



Turkey’s inflation data may embolden Erdogan
The inflation print beat expectations of 20.4% YoY, possibly because of the 200bps rate cut on October 21st!
Share this:

At the Central Bank of Turkey’s last meeting, members decided to cut the interest from by 200bps, from 18% to 16%. Expectations were for a cut of only 50bps. They did this even though inflation rose to 19.58%, its highest level since March 2019. Why did they do this? As my colleague Matt Weller pointed out, Turkey’s President Erdogan dismissed several of the central bank’s governors, including the only one who opposed a cut at the previous meeting. He replaced them with 3 handpicked successors and predictably, they cut rates. However, they cut my much more than expected.
Today, Turkey released inflation data for October. The headline number was 19.89% YoY, slightly higher than September’s print of 19.58% YoY. This is the highest reading since January 2019. However, the inflation print beat expectations of 20.4% YoY, possibly because of the 200bps rate cut on October 21st! The Central Bank of Turkey meets again on November 18th. Based on the rate cut at the previous meeting, one could assume the 3 replaced governors will do as Erdogan wishes. Will the inflation beat give Erdogan a feeling confidence to cut interest rates again at the next meeting (although, of course, it’s not his decision)?
Trade USD/TRY now: Login or open a new account!
The weaker inflation data pushed USD/TRY to near all-time highs set on October 25th, at 9.8496. On that day, price action formed a shooting star candlestick which indicated the pair was ready for a possible pullback, especially with the RSI in overbought territory and diverging from price! However, the pair thus far has beaten the analytics and traded as high as 9.7823 today.

Source: Tradingview, Stone X
On a 240-minute timeframe, above the highs from October 25th, resistance is at the convergence of the 127.2% Fibonacci extension from the October 25th highs to the October 26th lows near 9.9844 and the psychological round number of 10.0000. The next resistance is at 161.8% Fibonacci extension from the same timeframe near 10.1353. Support is at the convergence of the October 26th lows and an upward sloping trendline dating back to mid-September near 9.4297, then the October 20th lows at 9.2049.

Source: Tradingview, Stone X
With Erdogan (unofficially) at the helm of the Central Bank of Turkey, today’s inflation data may give him reassurance that he is doing the right thing by having the central bank governors lower interest rates. However, if expectations are for more rate cuts, watch for USD/TRY push for stops above 10.000!
Learn more about forex trading opportunities.
At the Central Bank of Turkey’s last meeting, members decided to cut the interest from by 200bps, from 18% to 16%. Expectations were for a cut of only 50bps. They did this even though inflation rose to 19.58%, its highest level since March 2019. Why did they do this? As my colleague Matt Weller pointed out, Turkey’s President Erdogan dismissed several of the central bank’s governors, including the only one who opposed a cut at the previous meeting. He replaced them with 3 handpicked successors and predictably, they cut rates. However, they cut my much more than expected.
Today, Turkey released inflation data for October. The headline number was 19.89% YoY, slightly higher than September’s print of 19.58% YoY. This is the highest reading since January 2019. However, the inflation print beat expectations of 20.4% YoY, possibly because of the 200bps rate cut on October 21st! The Central Bank of Turkey meets again on November 18th. Based on the rate cut at the previous meeting, one could assume the 3 replaced governors will do as Erdogan wishes. Will the inflation beat give Erdogan a feeling confidence to cut interest rates again at the next meeting (although, of course, it’s not his decision)?
Trade USD/TRY now: Login or Open a new account!
• Open an account in the UK
• Open an account in Australia
• Open an account in Singapore
The weaker inflation data pushed USD/TRY to near all-time highs set on October 25th, at 9.8496. On that day, price action formed a shooting star candlestick which indicated the pair was ready for a possible pullback, especially with the RSI in overbought territory and diverging from price! However, the pair thus far has beaten the analytics and traded as high as 9.7823 today.
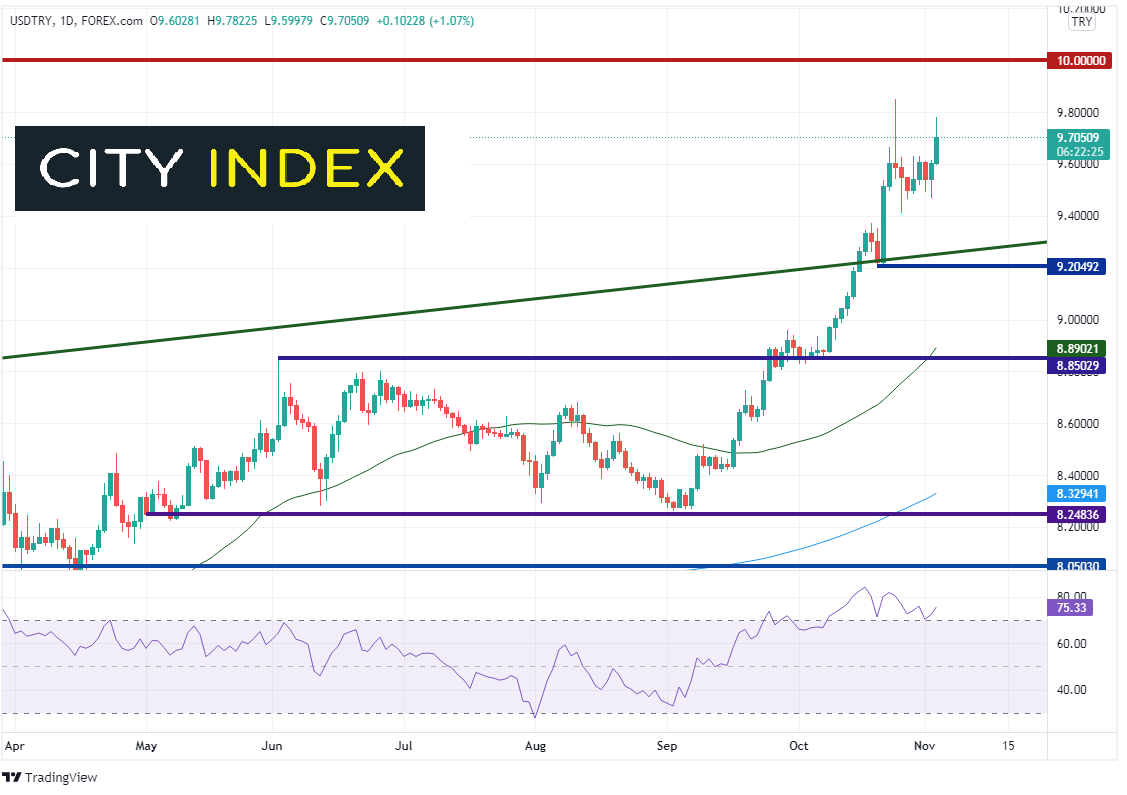
Source: Tradingview, Stone X
On a 240-minute timeframe, above the highs from October 25th, resistance is at the convergence of the 127.2% Fibonacci extension from the October 25th highs to the October 26th lows near 9.9844 and the phycological round number of 10.0000. The next resistance is at 161.8% Fibonacci extension from the same timeframe near 10.1353. Support is at the convergence of the October 26th lows and an upward sloping trendline dating back to mid-September near 9.4297, then the October 20th lows at 9.2049.

Source: Tradingview, Stone X
With Erdogan (unofficially) at the helm of the Central Bank of Turkey, today’s inflation data may give him reassurance that he is doing the right thing by having the central bank governors lower interest rates. However, if expectations are for more rate cuts, watch for USD/TRY push for stops above 10.000!
Learn more about forex trading opportunities.
Related tags:


Open an account in minutes
Experience award-winning platforms with fast and secure execution, and enjoy tight spreads from 0.5 pts on FX and 0.3 pts on indices.
Economic calendar
Web Trader platform
Our sophisticated web-based platform is packed with features.
Related articles

AUD/USD, NZD/USD Outlook: Corrective Recoveries Face Growing Headwinds
A weaker US dollar, falling Treasury yields and renewed demand for cyclical assets have supported the Aussie and Kiwi. But with some of those moves reversing on Monday, both currencies face an early test of whether their recent strength can continue.

Canadian Dollar Defies Soft CPI as Inflation Expectations Rise
The Canadian dollar strengthens despite CPI missing expectations, as rising long-term inflation expectations complicate the BoC outlook for USD/CAD and AUD/CAD.


US Dollar, GBP/USD, USD/CAD, USD/CHF, Gold Weekly Technical Outlook 10 19 2026
Sr. Technical Strategist Michael Boutros highlights the levels that matter on the USD Majors, commodities, and equity indices charts this week.

This report is intended for general circulation only. It should not be construed as a recommendation, or an offer (or solicitation of an offer) to buy or sell any financial products. The information provided does not take into account your specific investment objectives, financial situation or particular needs. Before you act on any recommendation that may be contained in this report, independent advice ought to be sought from a financial adviser regarding the suitability of the investment product, taking into account your specific investment objectives, financial situation or particular needs.
StoneX Financial Pte. Ltd., may distribute reports produced by its respective foreign entities or affiliates within the StoneX group of companies or third parties pursuant to an arrangement under Regulation 32C of the Financial Advisers Regulations. Where the report is distributed to a person in Singapore who is not an accredited investor, expert investor or an institutional investor (as defined in the Securities Futures Act), StoneX Financial Pte. Ltd. accepts legal responsibility to such persons for the contents of the report only to the extent required by law. Singapore recipients should contact StoneX Financial Pte. Ltd. at 6826 9988 for matters arising from, or in connection with the report.
In the case of all other recipients of this report, to the extent permitted by applicable laws and regulations neither StoneX Financial Pte. Ltd. nor its associated companies will be responsible or liable for any loss or damage incurred arising out of, or in connection with, any use of the information contained in this report and all such liability is hereby expressly disclaimed. No representation or warranty is made, express or implied, that the content of this report is complete or accurate.
StoneX Financial Pte. Ltd. is not under any obligation to update this report.
Trading CFDs carries a high level of risk that may not be suitable for some investors. Consider your investment objectives, level of experience, financial resources, risk appetite and other relevant circumstances carefully. The possibility exists that you could lose some or all of your investments, including your initial deposits. If in doubt, please seek independent expert advice. Visit www.forex.com/en-sg/terms-and-policies for the complete Risk Disclosure Statement.