



US Dollar for This Week: EUR/USD, USD/JPY, GBP/USD
The Euro is the big focal point for the US Dollar this week as the largest component of DXY goes into an ECB rate decision, and the EUR/USD bearish trend has been stalled for the past few weeks.
Share this:

US Dollar Technical Analysis:
- Last week could’ve been much worse for the USD given the below-expected CPI and PPI prints, but so far it’s held support at prior resistance.
- USD/JPY retains bullish breakout potential and that’s probably one of the more attractive bullish majors for the USD this week, while GBP/USD retains bullish potential itself setting up as one of the more attractive for USD-weakness.
- The big part of the DXY basket is in view this week with the ECB rate decision and EUR/USD has seen the sell-off stall over the past few weeks, with 1.1500 as a major barrier level on pullback scenarios.
This content was created by an affiliate of FOREX.com and represents the views and opinions of the author/speakers, not the views and opinions of Forex.com, StoneX Group Inc., or its subsidiaries. The content has not been independently reviewed by FOREX.com.
USD
Last week was one of those episodes where it could’ve went very differently for the US Dollar, as below-expected CPI and PPI highlighted less urgency for the rate hikes that have been priced in for later this year.
That has not come to pass, however, as the Tuesday and Wednesday pullback led to a rally in the Greenback, and so far this week, that move has continued. From the weekly chart below we can see the DXY basket holding support at prior resistance and this again points to bullish technical structure.
For this week, the big item is the European Central Bank rate decision and the EUR/USD pair remains in an unsettled place, as the bearish trend and fresh lows have been on pause for the past few weeks, but buyers have seemingly been unable to prod for re-test of the 1.1500 handle. That will likely be the big driver for the USD for this week.
US Dollar Weekly Price Chart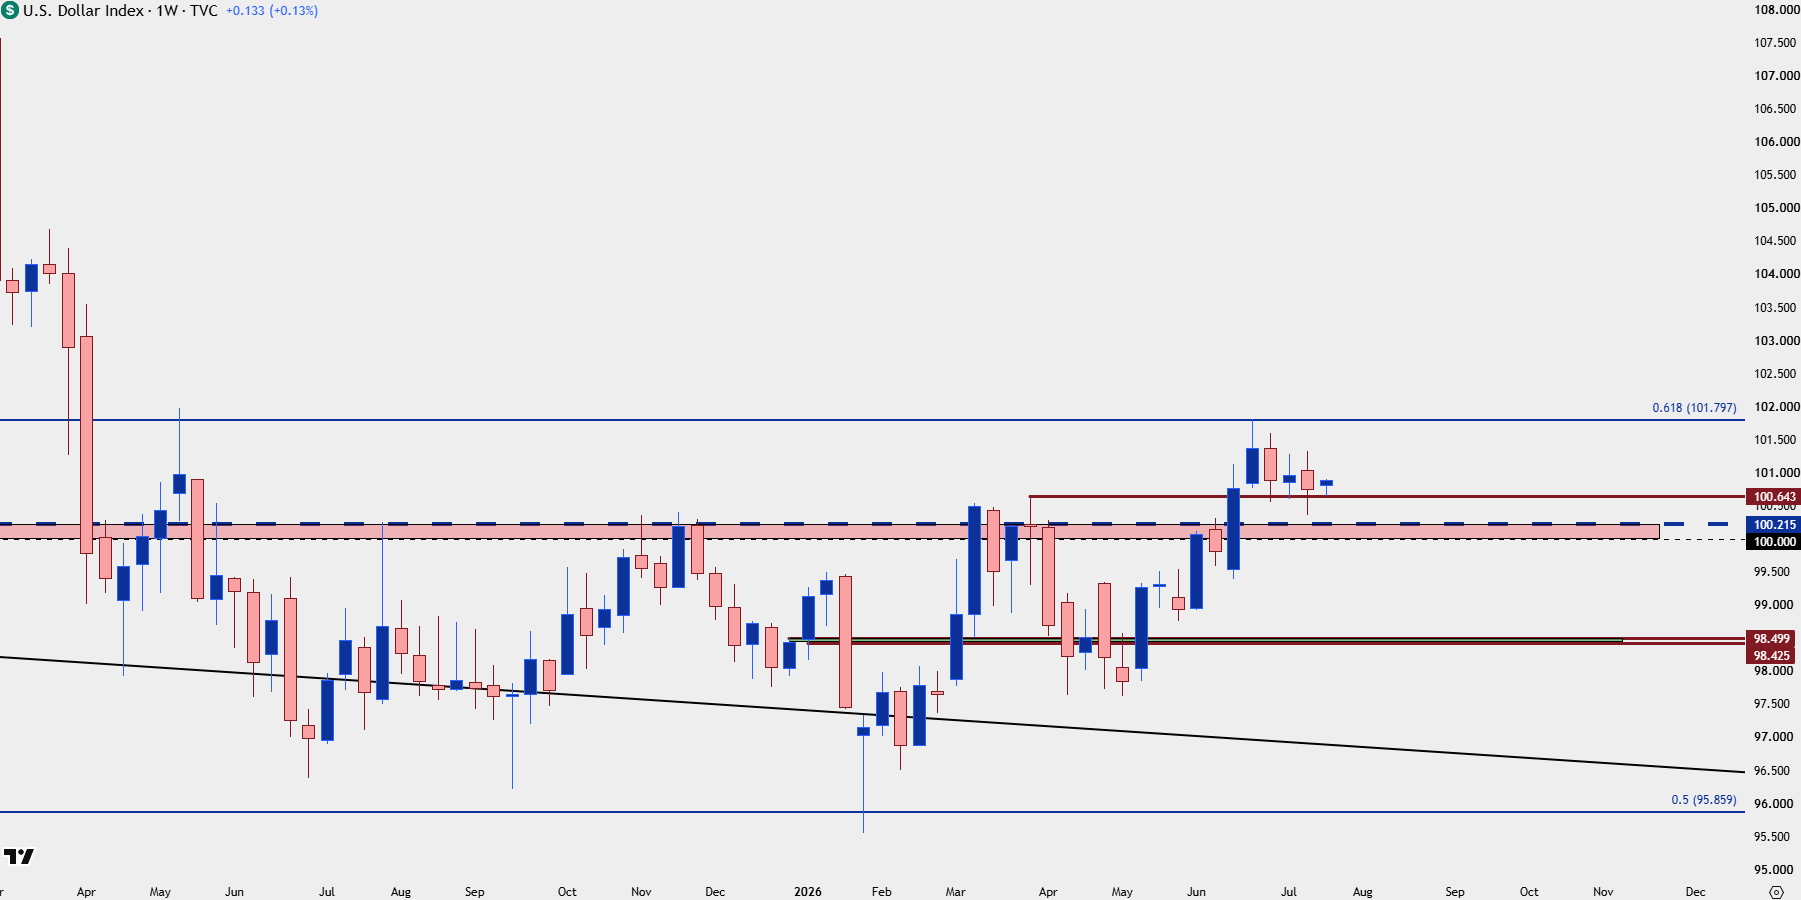
Chart prepared by James Stanley; data derived from Tradingview
EUR/USD
In last week’s USD webinar, I looked at three different resistance areas in EUR/USD, and so far the most nearby has held the highs at 1.1469. But the bigger question is whether there’s now enough motivation from bears to finally break through to a fresh low, as that’s been the lacking component going back to late-June and while the daily chart looks messy, the weekly chart highlights this well. This is why we have the old saying in charting of ‘when in doubt, zoom out.’
EUR/USD Weekly Chart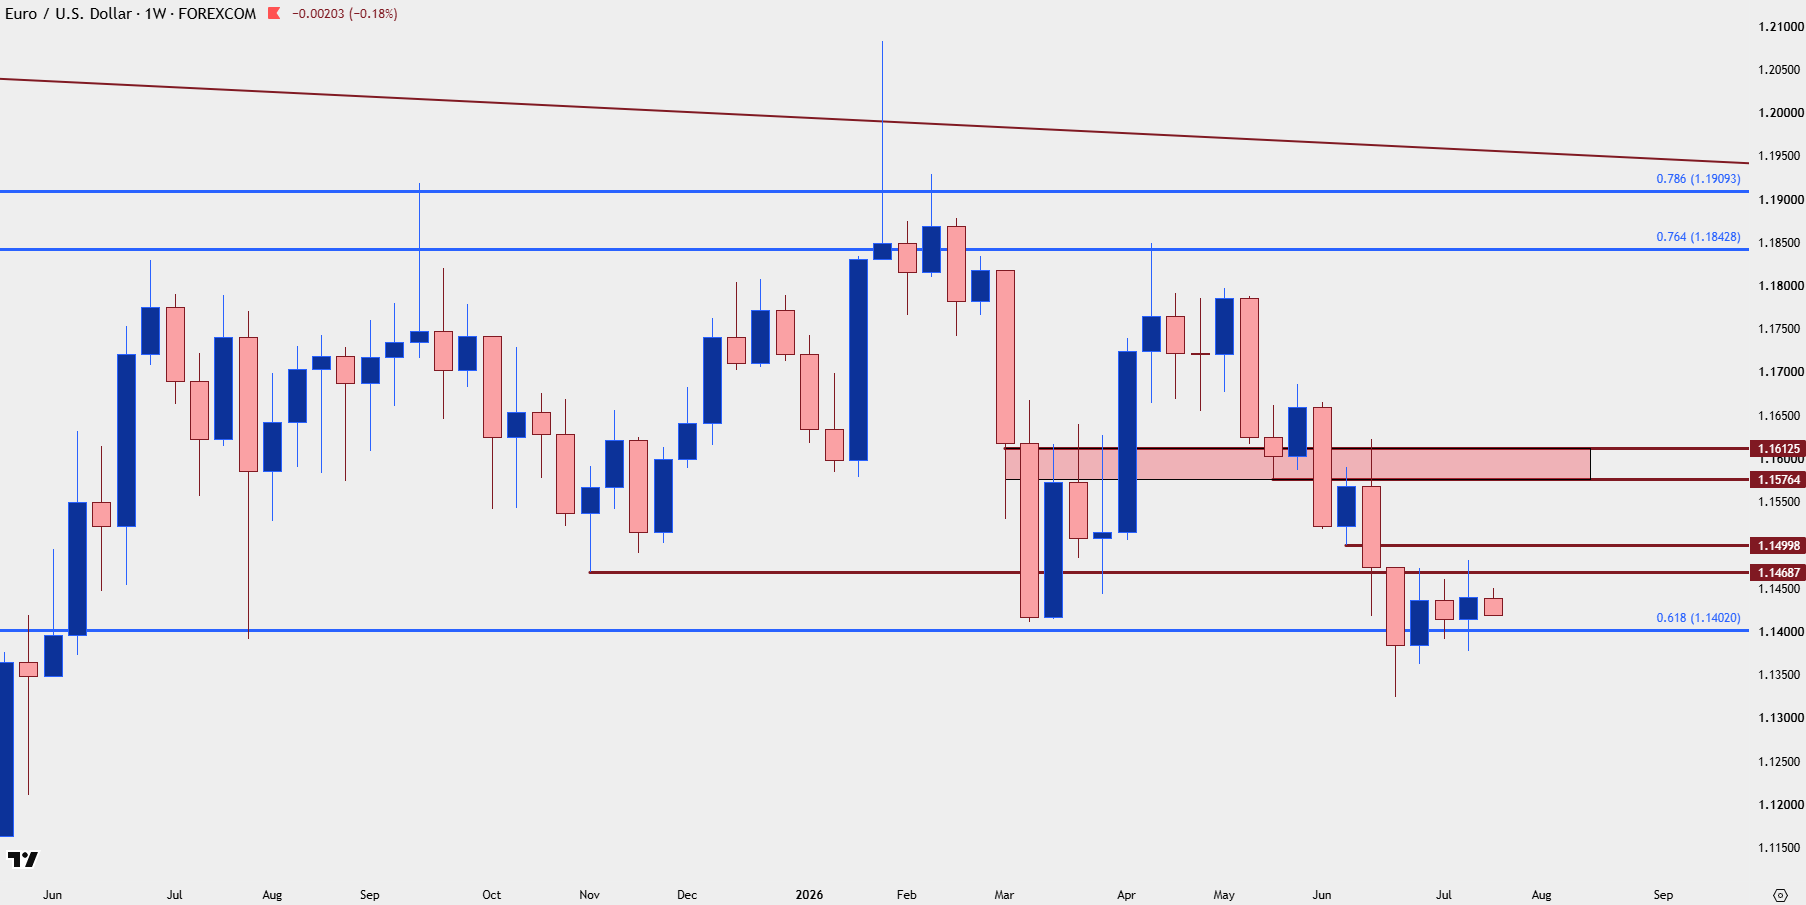
Chart prepared by James Stanley; data derived from Tradingview
EUR/USD Daily
From the daily chart we can see that counter-trend motive well and while messy, this can be argued as a bear flag type of formation given the bullish counter-trend grind over the past few weeks.
Given the ECB meeting on the calendar, this would seem opportune time for the larger trend to present itself, which would point to further DXY strength as the Euro is a whopping 57.6% of the DXY basket. The next resistance level up, the price that bulls have not wanted to encroach upon yet since breaking below a moth ago, is at the 1.1500 level.
EUR/USD Daily Chart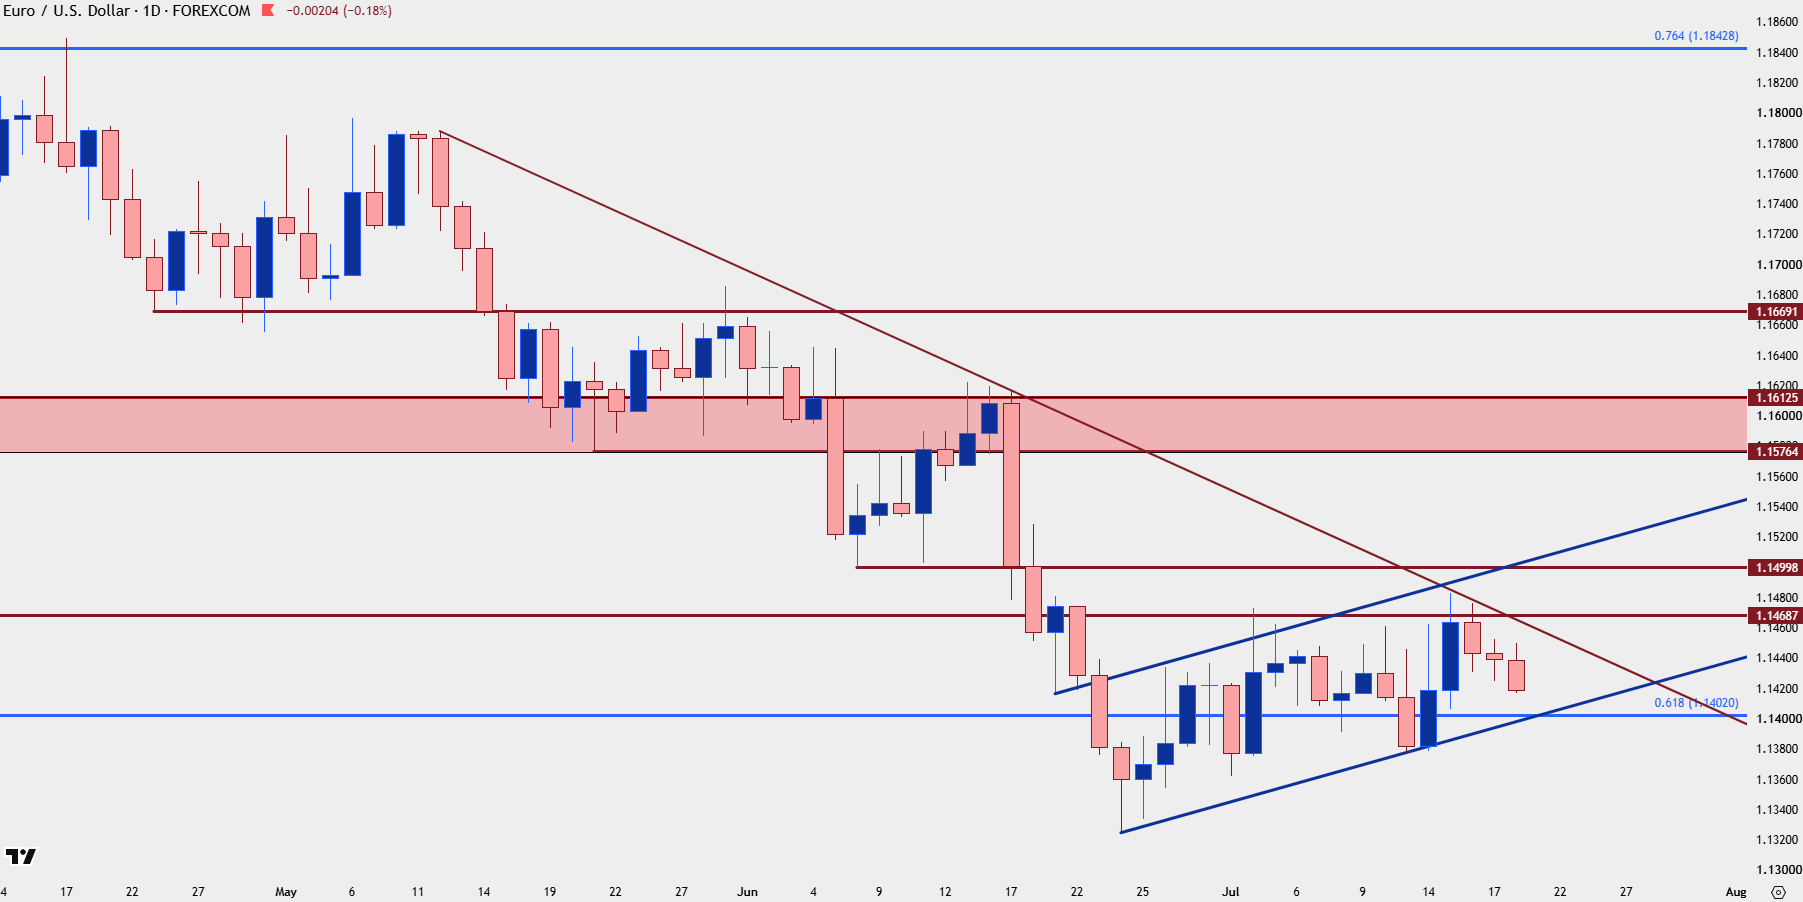
Chart prepared by James Stanley; data derived from Tradingview
USD/JPY
The Japanese Yen is the second largest component of the DXY basket and the Japanese Yen weakness theme remains as a big part of the relative strength in the USD. At this point, the USD/JPY pair holds an ascending triangle formation, which is a bullish breakout formation that points to the possibility of topside breakouts and trend continuation.
As looked at last week, the 165 level is the next major level up and that’s a price that hasn’t traded in USD/JPY since 1986. But – central to that bullish reaction in DXY after PPI and CPI was a similar outing in USD/JPY, and I had looked at this possibility on Monday, highlighting that trend traders could view that weakness as opportunity, which so far they have.
USD/JPY Daily Price Chart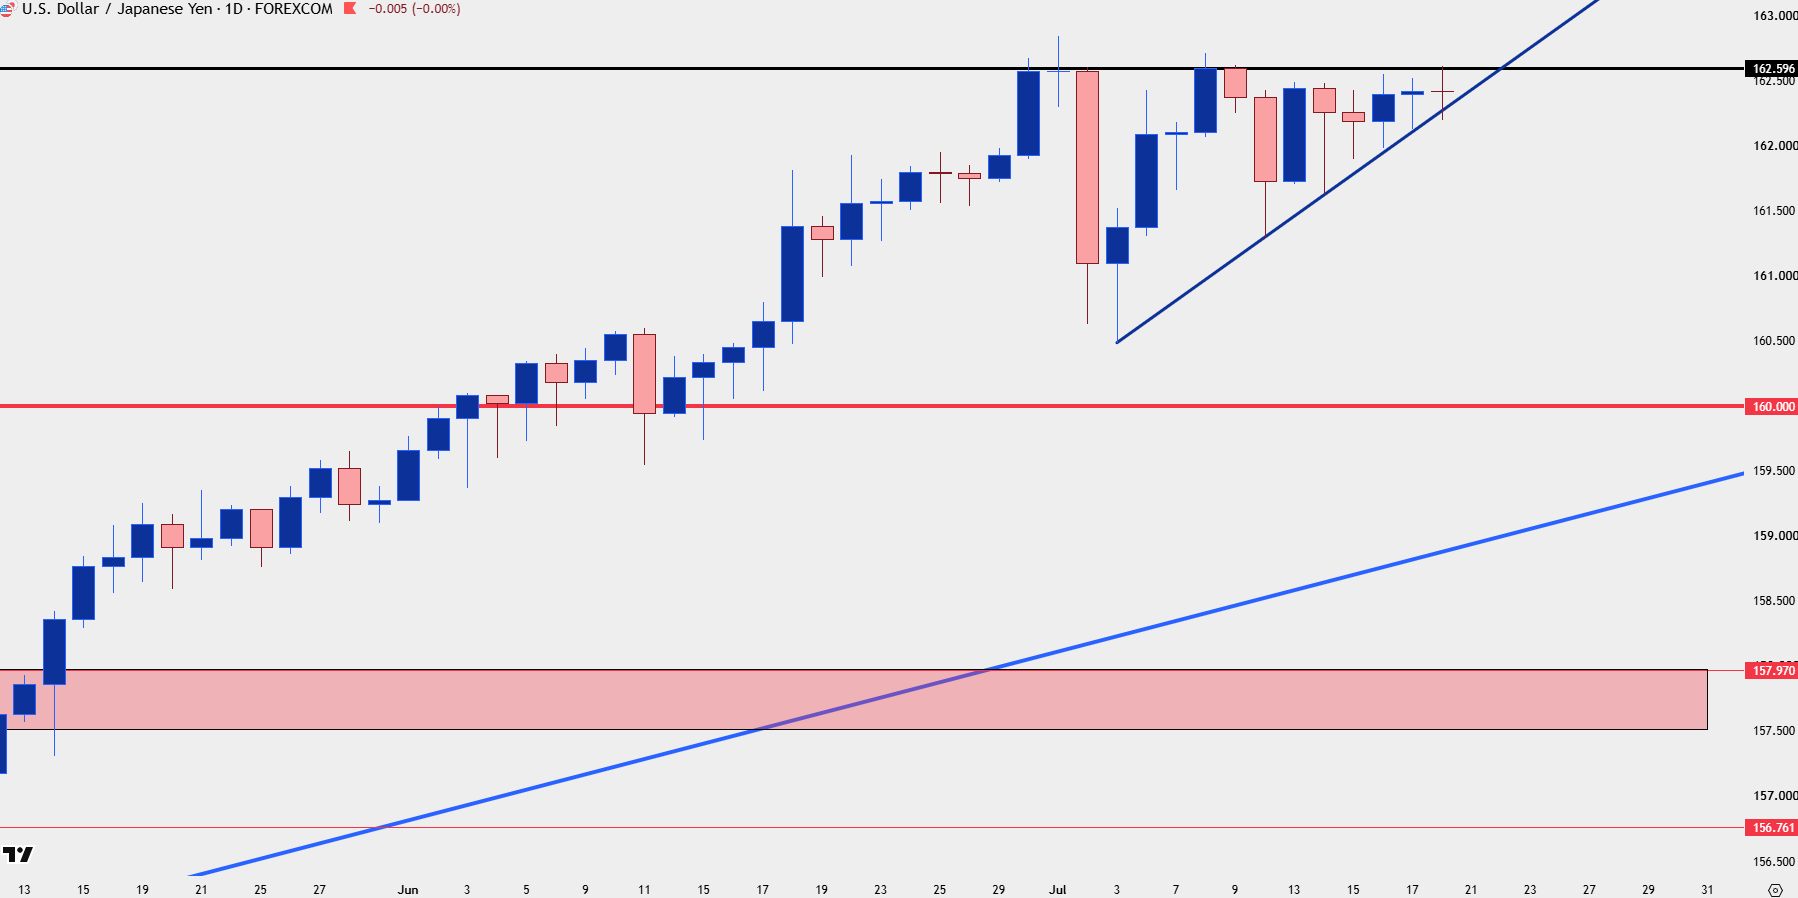
Chart prepared by James Stanley; data derived from Tradingview
GBP/USD
While the EUR/USD sell-off has stalled over the past few weeks but the pair showing an inability to climb above 1.1500, GBP/USD has sprung into what could be argued as a bullish trend given a recent higher-high.
I looked into the pair last week and highlighted three support areas. The first of those areas has so far helped to hold the lows around 1.3450. The second, just below, spans from a Fibonacci level at 1.3390 up to 1.3400, and the third is a prior swing around 1.3325.
For those looking to take bearish stances on the USD this stands out as one of the more attractive major pairs currently available.
GBP/USD Daily Price Chart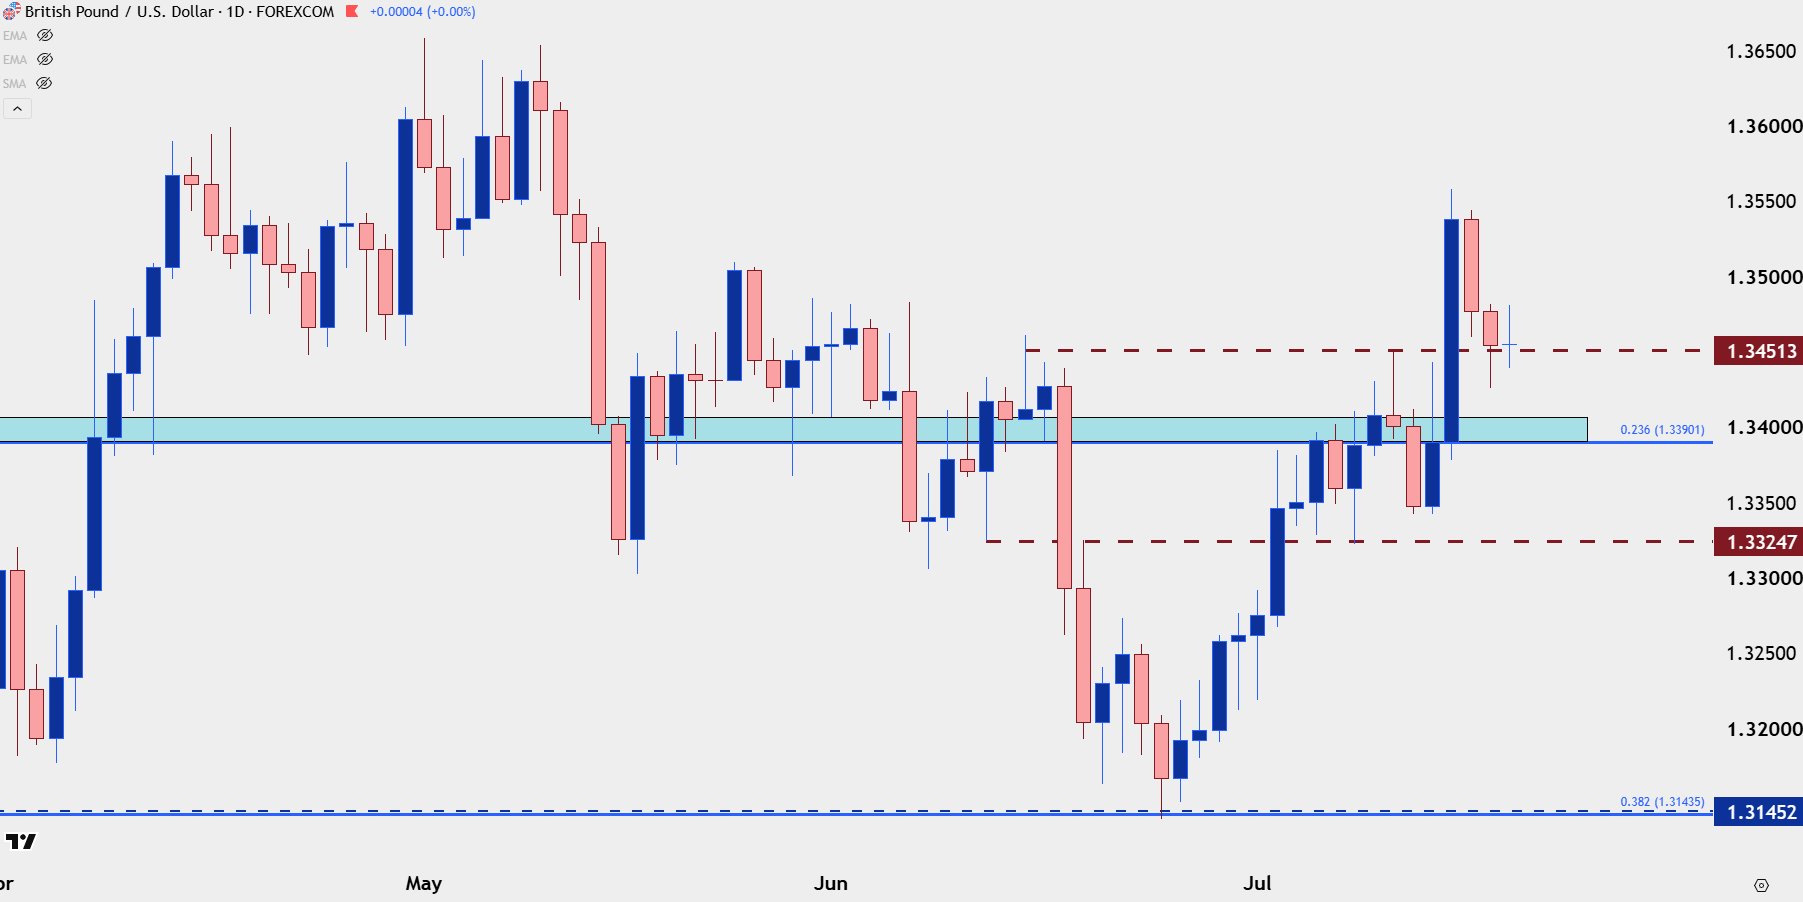
Chart prepared by James Stanley; data derived from Tradingview
--- written by James Stanley, Senior Market Analyst, Global Macro
Latest market news




Open an account in minutes
Experience award-winning platforms with fast and secure execution, and enjoy tight spreads from 0.5 pts on FX and 0.3 pts on indices.
Economic calendar
Web Trader platform
Our sophisticated web-based platform is packed with features.
Related articles
EUR/USD Q4 2026 Outlook: Euro at a Crossroads as Fed, ECB Tighten 9 25 2026
EUR/USD enters Q4 at a pivotal inflection point as competing Fed-ECB policy paths and persistent inflation risks collide with major technical support.

Equity Indices Q4, 2026 Outlook: Cracks Begin to Show
There's still an open door for a melt-up in the S&P 500 and Nasdaq but the Dow and Russell 2000 are looking more vulnerable, and until calm hits the Treasuries market there's a higher probability for volatility. The big question is whether that's a next quarter theme or not.
S&P 500 Forecast: SPX rises as oil prices fall, but treasuries remain at multi-decade highs
U.S. stocks are rising on Friday after a volatile week that saw a surge in Treasury yields ripple through financial markets.

This report is intended for general circulation only. It should not be construed as a recommendation, or an offer (or solicitation of an offer) to buy or sell any financial products. The information provided does not take into account your specific investment objectives, financial situation or particular needs. Before you act on any recommendation that may be contained in this report, independent advice ought to be sought from a financial adviser regarding the suitability of the investment product, taking into account your specific investment objectives, financial situation or particular needs.
StoneX Financial Pte. Ltd., may distribute reports produced by its respective foreign entities or affiliates within the StoneX group of companies or third parties pursuant to an arrangement under Regulation 32C of the Financial Advisers Regulations. Where the report is distributed to a person in Singapore who is not an accredited investor, expert investor or an institutional investor (as defined in the Securities Futures Act), StoneX Financial Pte. Ltd. accepts legal responsibility to such persons for the contents of the report only to the extent required by law. Singapore recipients should contact StoneX Financial Pte. Ltd. at 6826 9988 for matters arising from, or in connection with the report.
In the case of all other recipients of this report, to the extent permitted by applicable laws and regulations neither StoneX Financial Pte. Ltd. nor its associated companies will be responsible or liable for any loss or damage incurred arising out of, or in connection with, any use of the information contained in this report and all such liability is hereby expressly disclaimed. No representation or warranty is made, express or implied, that the content of this report is complete or accurate.
StoneX Financial Pte. Ltd. is not under any obligation to update this report.
Trading CFDs carries a high level of risk that may not be suitable for some investors. Consider your investment objectives, level of experience, financial resources, risk appetite and other relevant circumstances carefully. The possibility exists that you could lose some or all of your investments, including your initial deposits. If in doubt, please seek independent expert advice. Visit www.forex.com/en-sg/terms-and-policies for the complete Risk Disclosure Statement.