





U.S. Dollar Price Action Setups: EUR/USD, SPX, Gold, GBP/USD
The USD is continuing a bounce and stocks are pushing higher to further moves that started to spark last week.
Share this:

U.S. Dollar Talking Points:
- This webinar extended the prior week’s discussion where I was looking for a pullback in the USD, which could potentially turn into something more. At this point we have the bounce in DXY and there’s an open door for bulls to make a larger mark given a support test at prior resistance.
- That turn is mirrored in EUR/USD as the pair has dipped down to the 1.0800 handle.
- For USD-weakness, I still think that GBP/USD could produce a more attractive backdrop and the pair is currently working on a morning star formation on the daily chart.
- Also in focus for the webinar was the turn in SPX, the $3k breakout in Gold and the age-old trading mantra of ‘know yourself,’ as many of these counter-trend bounces have already stretched quite far. To join next week’s webinar, click here for registration information.
In last week’s webinar ahead of the FOMC rate decision, I was looking for a pullback in both USD and EUR/USD which could potentially turn into something more. A week later, the pullback is in and the question now for both markets is whether the ‘something more’ aspect comes to fruition.
In DXY, resistance has held at the Fibonacci level of 104.38 and the pullback from that has so far held support at prior resistance, at the Fibonacci level at 103.98. There can be a case for support down to around 103.74 and that can keep the door open for USD-strength, although it will likely need a greater push from Euro bears as I’ll look at in a moment.
U.S. Dollar Four-Hour Price Chart
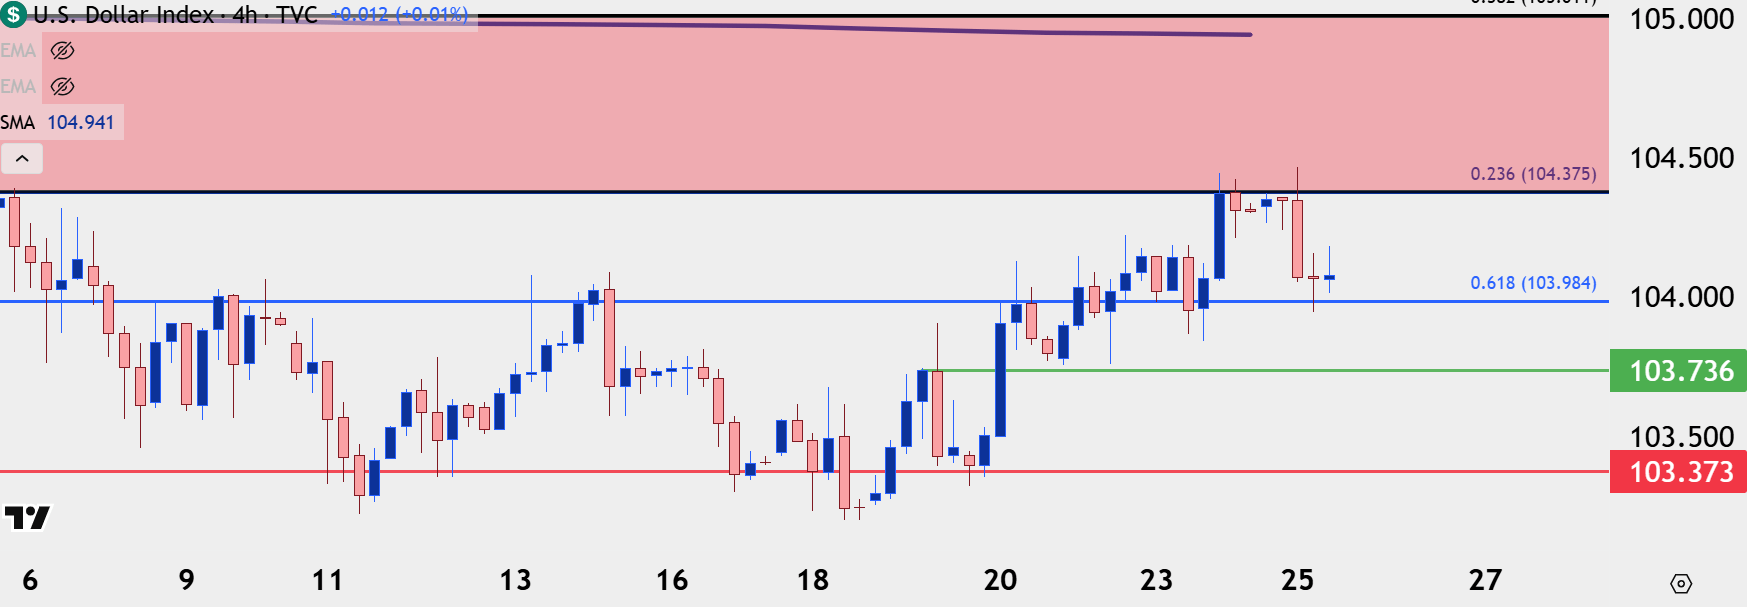 Chart prepared by James Stanley; data derived from Tradingview
EUR/USD Retrace from Fibo Resistance
Going along with that pullback in the USD is a pullback in EUR/USD, with the same Fibonacci level of 1.0943 holding the highs again after last week’s webinar. Price has pushed down to 1.0800 and that’s been the low for the past few days; but if we are going to see those pullbacks extend in either USD and/or EUR/USD, it seems that Euro bears will need to make a push down for a test of the 200-day moving average, currently plotted around 1.0730. I’ve spanned that up to the 1.0750 psychological level to create a support zone, and if the pair gets down there, it’ll be an opportunity for bulls to join in the recent trend. But, if they don’t that’s where the larger turn scenarios become more attractive around the U.S. Dollar.
EUR/USD Daily Price Chart
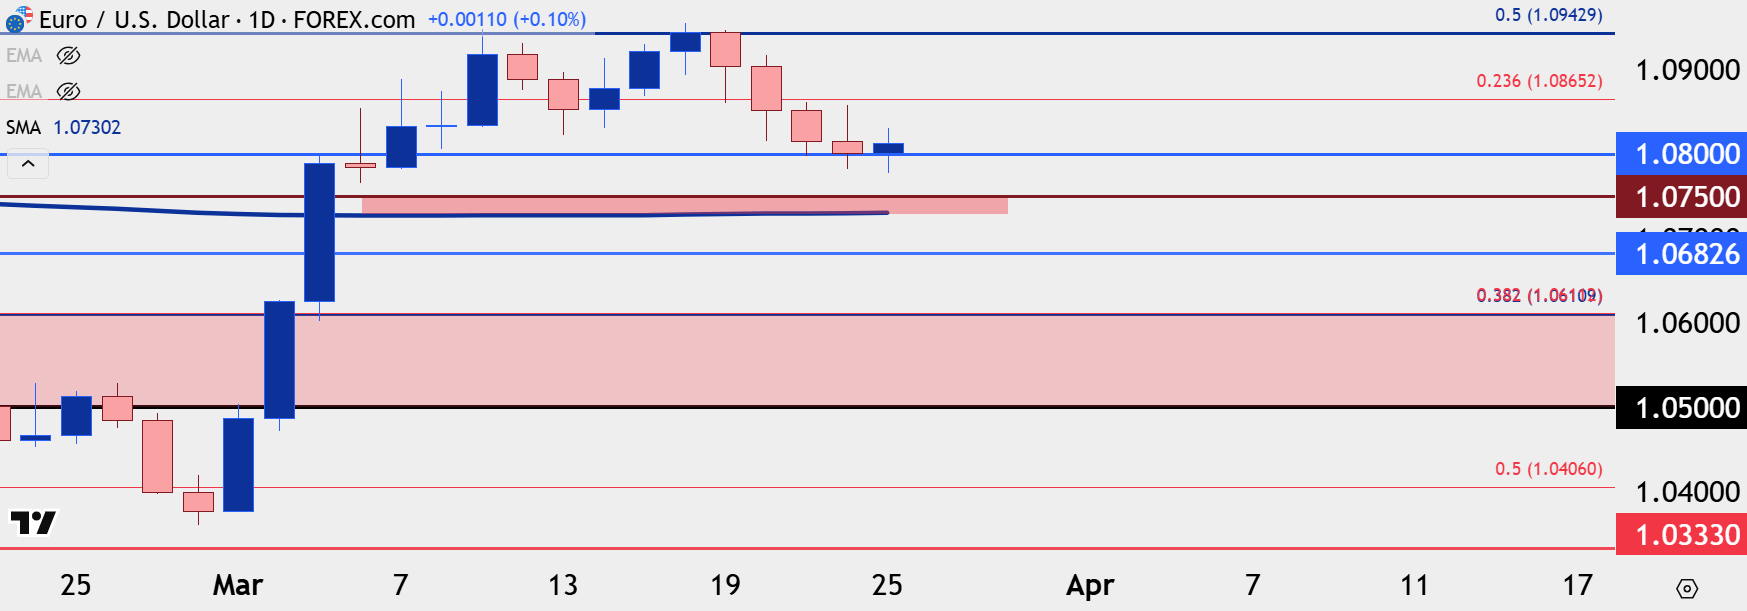 Chart prepared by James Stanley; data derived from Tradingview
SPX
The theme for this webinar was ‘know who you are as a trader,’ because frankly, there’s never a ‘free trade’ or ‘a for sure setup,’ there’s always going to be risk involved. And after a decisive move, the trader is faced with the possible downsides of either buying a top (or selling a bottom), or trying to be patient and missing an opportunity to join the trend.
There’s also the matter of sentiment, where many people appear to get very bullish after selloffs and very aggressive after rallies. I extrapolated on that topic back in September of 2023, sharing a quote from John Templeton, ‘the time of maximum pessimism is the best time to buy, and the time of maximum optimism is the best time to sell.’
Well, just a couple weeks ago pessimism was running rampant in U.S. equities as fears of recession had permeated the headlines. Last week produced both an inside bar and a spinning top for SPX, and so far this week, bulls are reversing the prior move. From a short-term basis, however, this can be an incredibly difficult move to chase-higher, and instead, traders can try to be patient by waiting for a pullback and a possible test of support.
The 5750 level is a big spot for SPX as this is both a Fibonacci level and the 200-day moving average, and below that there’s support at 5705 and then 5670.
SPX Hourly Price Chart
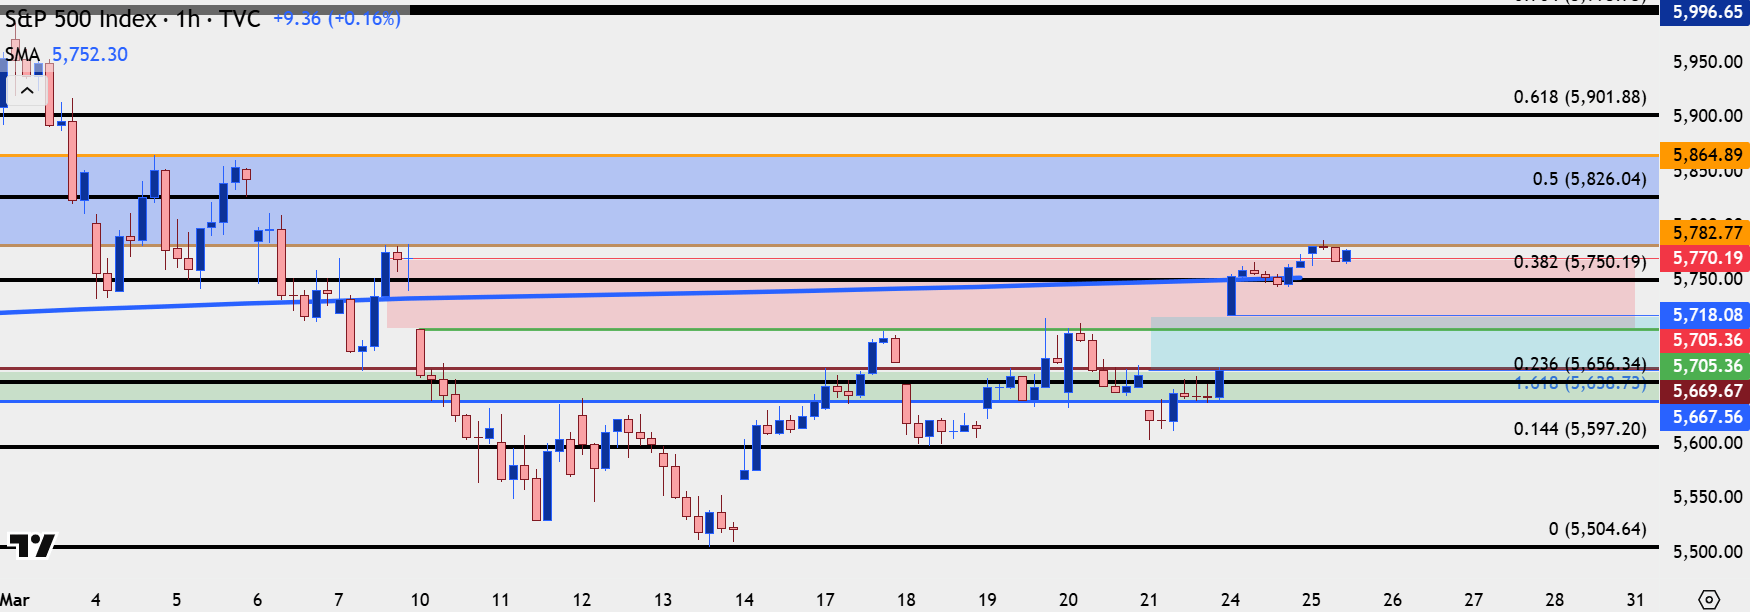 Chart prepared by James Stanley; data derived from Tradingview
Gold
Gold exhibits that psychological element of fear of chasing balanced by a fear of missing out. The 3030 level has now held two strong resistance reactions so far this week, and the pullback in between made a fast run at $3k which saw buyers step in early, holding the low above the big figure.
As said in the webinar, I still have no evidence that would make me want to get bearish, but I’d also try to be picking as gold continues to trade above $3k/oz. Given the recent higher-highs and lows, there could be a case for short-term bullish momentum. But, on a bigger picture basis, it’s supports at $2950-$2954 that sticks out – and if a larger pullback does develop, the prior resistance from $2790-$2800.
Gold Hourly Price Chart
 Chart prepared by James Stanley; data derived from Tradingview
GBP/USD
I had looked at a similar theme in the Yen article yesterday, but the British Pound continues to show some signs of strength that could make it a more attractive candidate for USD-weakness scenarios than what’s shown in EUR/USD.
GBP/USD is currently working on a non-complete morning star formation, with support at a Fibonacci level plotted at 1.2900. There’s also been multiple tests above the 1.3000 big figure so far while EUR/USD hasn’t shown interest in testing 1.1000 yet. So, if we do see a breakaway bullish rally in either pair, EUR/USD will have to contend with 1.1000 resistance while GBP/USD has already tested above 1.3000.
GBP/USD Daily Chart
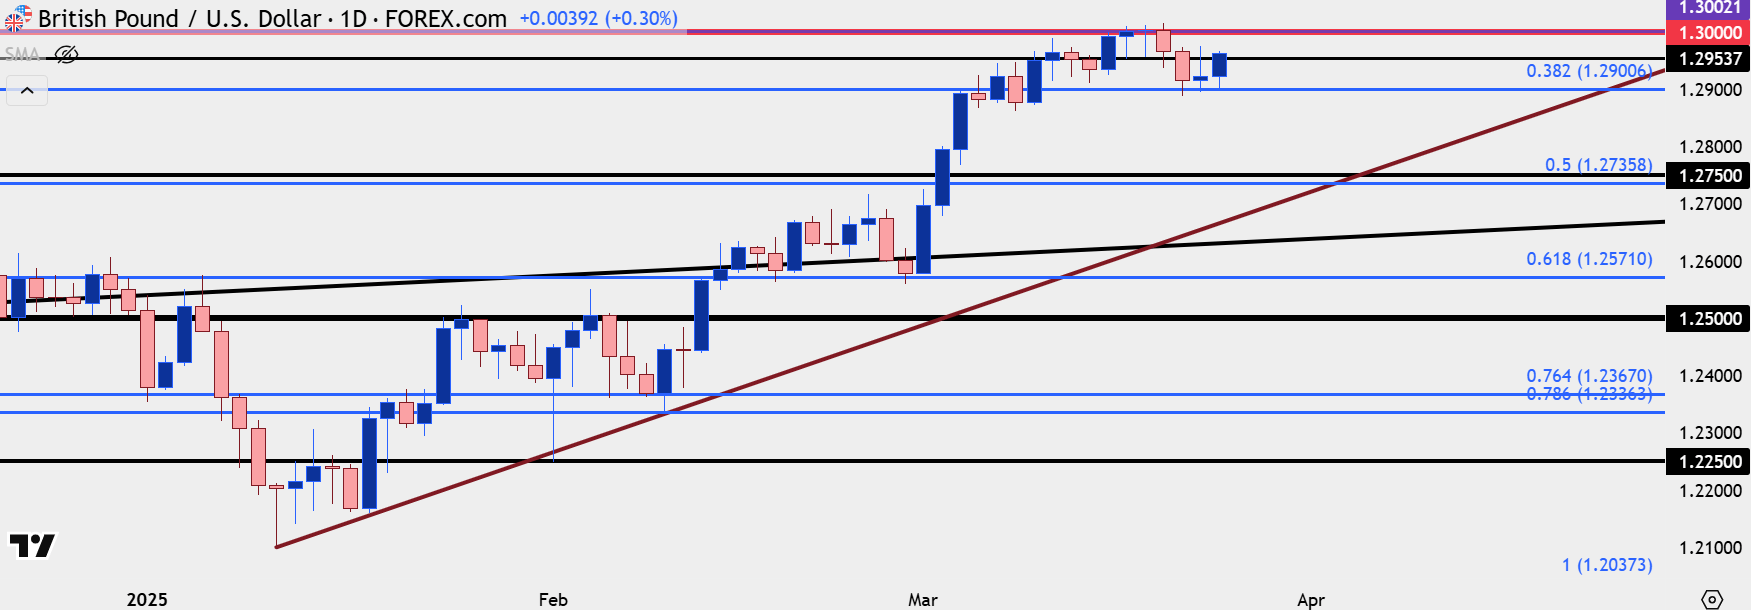 Chart prepared by James Stanley; data derived from Tradingview
--- written by James Stanley, Senior Strategist
U.S. Dollar Talking Points:
- This webinar extended the prior week’s discussion where I was looking for a pullback in the USD, which could potentially turn into something more. At this point we have the bounce in DXY and there’s an open door for bulls to make a larger mark given a support test at prior resistance.
- That turn is mirrored in EUR/USD as the pair has dipped down to the 1.0800 handle.
- For USD-weakness, I still think that GBP/USD could produce a more attractive backdrop and the pair is currently working on a morning star formation on the daily chart.
- Also in focus for the webinar was the turn in SPX, the $3k breakout in Gold and the age-old trading mantra of ‘know yourself,’ as many of these counter-trend bounces have already stretched quite far. To join next week’s webinar, click here for registration information.
In last week’s webinar ahead of the FOMC rate decision, I was looking for a pullback in both USD and EUR/USD which could potentially turn into something more. A week later, the pullback is in and the question now for both markets is whether the ‘something more’ aspect comes to fruition.
In DXY, resistance has held at the Fibonacci level of 104.38 and the pullback from that has so far held support at prior resistance, at the Fibonacci level at 103.98. There can be a case for support down to around 103.74 and that can keep the door open for USD-strength, although it will likely need a greater push from Euro bears as I’ll look at in a moment.
U.S. Dollar Four-Hour Price Chart
Chart prepared by James Stanley; data derived from Tradingview
EUR/USD Retrace from Fibo Resistance
Going along with that pullback in the USD is a pullback in EUR/USD, with the same Fibonacci level of 1.0943 holding the highs again after last week’s webinar. Price has pushed down to 1.0800 and that’s been the low for the past few days; but if we are going to see those pullbacks extend in either USD and/or EUR/USD, it seems that Euro bears will need to make a push down for a test of the 200-day moving average, currently plotted around 1.0730. I’ve spanned that up to the 1.0750 psychological level to create a support zone, and if the pair gets down there, it’ll be an opportunity for bulls to join in the recent trend. But, if they don’t that’s where the larger turn scenarios become more attractive around the U.S. Dollar.
EUR/USD Daily Price Chart
Chart prepared by James Stanley; data derived from Tradingview
SPX
The theme for this webinar was ‘know who you are as a trader,’ because frankly, there’s never a ‘free trade’ or ‘a for sure setup,’ there’s always going to be risk involved. And after a decisive move, the trader is faced with the possible downsides of either buying a top (or selling a bottom), or trying to be patient and missing an opportunity to join the trend.
There’s also the matter of sentiment, where many people appear to get very bullish after selloffs and very aggressive after rallies. I extrapolated on that topic back in September of 2023, sharing a quote from John Templeton, ‘the time of maximum pessimism is the best time to buy, and the time of maximum optimism is the best time to sell.’
Well, just a couple weeks ago pessimism was running rampant in U.S. equities as fears of recession had permeated the headlines. Last week produced both an inside bar and a spinning top for SPX, and so far this week, bulls are reversing the prior move. From a short-term basis, however, this can be an incredibly difficult move to chase-higher, and instead, traders can try to be patient by waiting for a pullback and a possible test of support.
The 5750 level is a big spot for SPX as this is both a Fibonacci level and the 200-day moving average, and below that there’s support at 5705 and then 5670.
SPX Hourly Price Chart
Chart prepared by James Stanley; data derived from Tradingview
Gold
Gold exhibits that psychological element of fear of chasing balanced by a fear of missing out. The 3030 level has now held two strong resistance reactions so far this week, and the pullback in between made a fast run at $3k which saw buyers step in early, holding the low above the big figure.
As said in the webinar, I still have no evidence that would make me want to get bearish, but I’d also try to be picking as gold continues to trade above $3k/oz. Given the recent higher-highs and lows, there could be a case for short-term bullish momentum. But, on a bigger picture basis, it’s supports at $2950-$2954 that sticks out – and if a larger pullback does develop, the prior resistance from $2790-$2800.
Gold Hourly Price Chart
Chart prepared by James Stanley; data derived from Tradingview
GBP/USD
I had looked at a similar theme in the Yen article yesterday, but the British Pound continues to show some signs of strength that could make it a more attractive candidate for USD-weakness scenarios than what’s shown in EUR/USD.
GBP/USD is currently working on a non-complete morning star formation, with support at a Fibonacci level plotted at 1.2900. There’s also been multiple tests above the 1.3000 big figure so far while EUR/USD hasn’t shown interest in testing 1.1000 yet. So, if we do see a breakaway bullish rally in either pair, EUR/USD will have to contend with 1.1000 resistance while GBP/USD has already tested above 1.3000.
GBP/USD Daily Chart
Chart prepared by James Stanley; data derived from Tradingview
--- written by James Stanley, Senior Strategist
Related tags:


Open an account in minutes
Experience award-winning platforms with fast and secure execution, and enjoy tight spreads from 0.5 pts on FX and 0.3 pts on indices.
Economic calendar
Web Trader platform
Our sophisticated web-based platform is packed with features.
Related articles
USD/CAD shooting star puts September surge on notice
USD/CAD has printed a clear bearish reversal pattern after an extraordinary September surge, but confirmation may depend heavily on how US Treasury yields react to Friday’s payrolls report.

USD/CHF Reverses as Swiss Franc Surges amid Bond Carnage
USD/CHF reverses from channel resistance as bond volatility surges and broad Swiss franc strength points to a possible carry-trade unwind.


Gold Price Forecast: XAU/USD Plunges 12.4% Toward Critical Support 10 1 2026
Softer inflation has revived expectations for a Fed pause, but Friday’s payrolls could put gold’s recovery prospects to the test.

This report is intended for general circulation only. It should not be construed as a recommendation, or an offer (or solicitation of an offer) to buy or sell any financial products. The information provided does not take into account your specific investment objectives, financial situation or particular needs. Before you act on any recommendation that may be contained in this report, independent advice ought to be sought from a financial adviser regarding the suitability of the investment product, taking into account your specific investment objectives, financial situation or particular needs.
StoneX Financial Pte. Ltd., may distribute reports produced by its respective foreign entities or affiliates within the StoneX group of companies or third parties pursuant to an arrangement under Regulation 32C of the Financial Advisers Regulations. Where the report is distributed to a person in Singapore who is not an accredited investor, expert investor or an institutional investor (as defined in the Securities Futures Act), StoneX Financial Pte. Ltd. accepts legal responsibility to such persons for the contents of the report only to the extent required by law. Singapore recipients should contact StoneX Financial Pte. Ltd. at 6826 9988 for matters arising from, or in connection with the report.
In the case of all other recipients of this report, to the extent permitted by applicable laws and regulations neither StoneX Financial Pte. Ltd. nor its associated companies will be responsible or liable for any loss or damage incurred arising out of, or in connection with, any use of the information contained in this report and all such liability is hereby expressly disclaimed. No representation or warranty is made, express or implied, that the content of this report is complete or accurate.
StoneX Financial Pte. Ltd. is not under any obligation to update this report.
Trading CFDs carries a high level of risk that may not be suitable for some investors. Consider your investment objectives, level of experience, financial resources, risk appetite and other relevant circumstances carefully. The possibility exists that you could lose some or all of your investments, including your initial deposits. If in doubt, please seek independent expert advice. Visit www.forex.com/en-sg/terms-and-policies for the complete Risk Disclosure Statement.