



US Dollar Retreats on Iran Peace Deal Hopes, Though AUD/USD Bears Eye 70c
Iran peace hopes weighed on the US dollar and lifted risk sentiment, though technicals still point to downside risks for AUD/USD.
Share this:

Markets embraced a wave of optimism that the US and Iran may be inching closer towards a peace deal, helping send crude oil prices sharply lower and weighing on the US dollar. Yet with no official confirmation from Washington, Tehran or Israel, traders remain cautious of another false dawn. I take a look at the technical outlook for the US dollar index (DXY), AUD/USD and EUR/AUD as geopolitical headlines continue to drive sentiment across FX markets.
View related analysis:
View related analysis:
Iran Peace Hopes Pressure DXY as AUD/USD and EUR/AUD Reach Key Levels
Markets are once again betting that the US and Iran are moving closer to a peace deal, despite pushback from Tehran that any such deal is imminent. Some social media channels are touting the usual ‘fake news’ from the MSM, while others claim Iran is seeking assistance from China to remove its highly enriched uranium from its territory.
The fact that crude oil prices fell nearly 7% on Monday certainly offers a glimmer of hope. However, we’ve seen enough false starts surrounding the end of this conflict to know it’s not over until it is officially confirmed by the US, Iran and Israel. No such confirmation has yet arrived, so I continue to treat these headlines as hopeful rumours.
And if those rumours prove false, we could quickly see a reversal of Monday’s move, resulting in a stronger US dollar, weaker Wall Street sentiment, a softer Australian dollar and renewed support for gold prices.
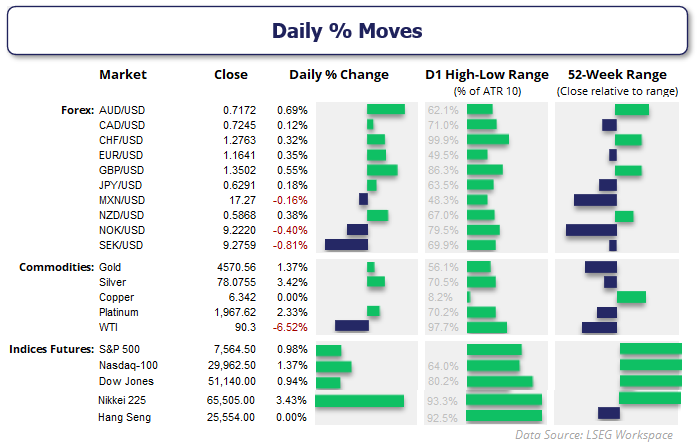
Source: LSEG
US Dollar Index (DXY) Technical Analysis
The daily chart shows the US dollar reached my 99.50 upside target last week, chosen because it sat between a gap resistance zone and the monthly R1 pivot point. A series of higher wicks yet lower daily highs — two of which were also inside days and bearish hammers — showed bullish momentum was waning.
While the USD retraced on Monday, the pullback has been relatively modest all things considered. That suggests to me that currency traders retain a degree of ambivalence over the latest US-Iran deadlines, while remaining cognizant of the fact that a hawkish Fed chair is at the helm and inflationary pressures persist.
This content was created by an affiliate of FOREX.com and represents the views and opinions of the author/speakers, not the views and opinions of FOREX.com, StoneX Group Inc., or its subsidiaries. The content has not been independently reviewed by FOREX.com.
US Dollar Pullback May Be Temporary
A move up towards 100 could still be on the cards. And that means I am on the lookout for evidence of a swing low near 98.50, around the monthly pivot point and the 50/200-day EMAs. The daily RSI is approaching — though not yet within — oversold territory on the RSI (2). And it may only take a headline or two suggesting negotiations have collapsed for the US dollar to regain a bid.
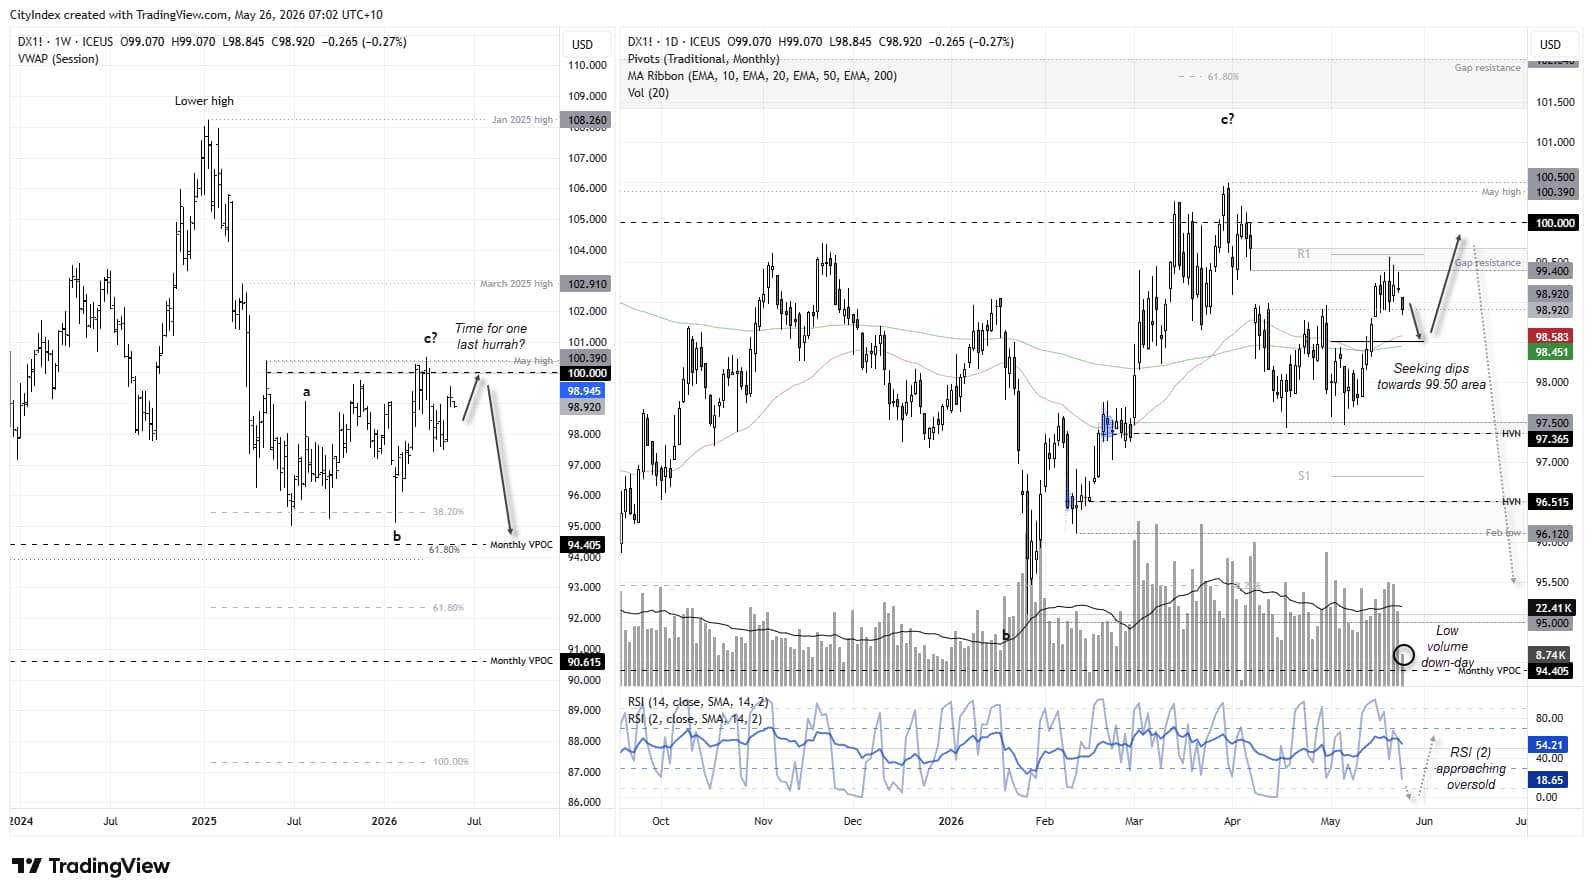
Source: ICE, TradingView
AUD/USD Technical Analysis: Australian Dollar vs US Dollar
The Aussie reached my downside target of 71c last week, inspired by the rising wedge pattern, weakness around cycle highs and arguably stretched market positioning. The breakout from the rising wedge was clean and direct — exactly the sort of price action I like to see from such patterns.
And the speed of the move also suggests this could be the first leg of an ABC correction. If so, the current consolidation and attempted rebound are assumed to be wave B. I am therefore now seeking evidence of a swing high to identify the beginning of a wave C lower.


Yield Differentials Point to Further AUD/USD Weakness
Furthermore, the AU-US 2-year yield differential is plunging ahead of AUD/USD spot prices. And with the US dollar index showing the potential to rise towards 100 once its current retracement lower is complete, I suspect the upside for AUD/USD could be limited before AUD/USD heads towards 70c.
The 4-hour chart shows a basing pattern above the monthly pivot point and the 71c handle. Should sentiment remain buoyant today, a move towards the 72c handle, high-volume node or weekly R2 pivot could be on the cards later this week. Yet these areas also mark a zone for bears to monitor for a potential bearish reversal ahead of the anticipated move towards 70c.
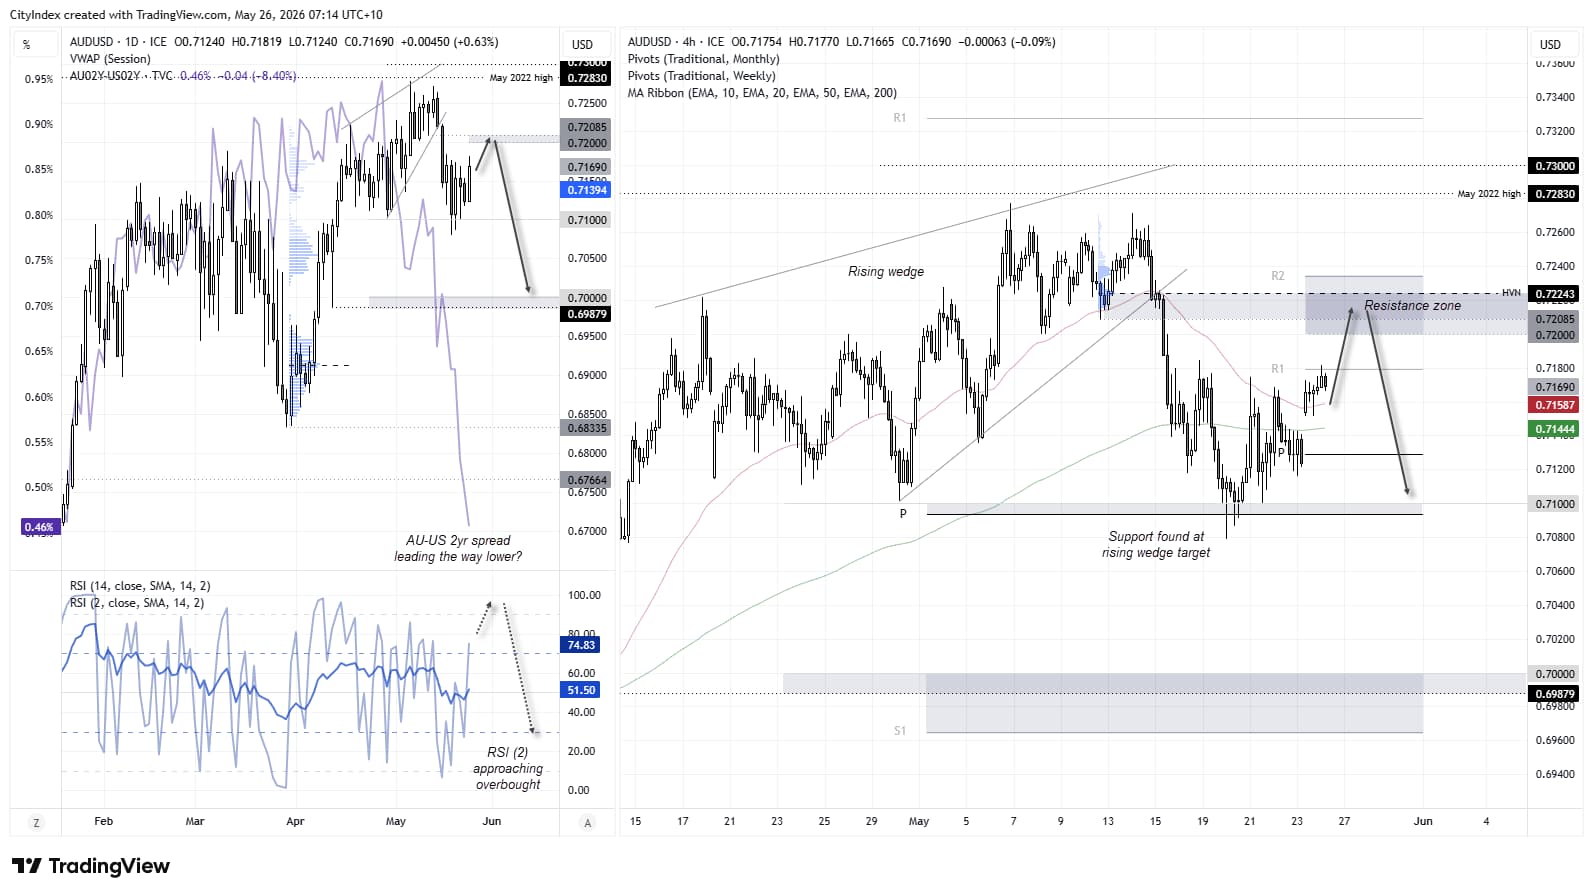
Source: ICE, TradingView


EUR/AUD Technical Analysis: Euro vs Australian Dollar
If I am correct in assuming a higher US dollar and lower Aussie in the foreseeable future, that could become a bullish cue for EUR/AUD. While the euro remains within an established downtrend against the Australian dollar, support has been found around the March low and monthly S1 pivot.
We’ve seen a modest rebound from the 1.6130 support area, although prices are now retracing lower. Should EUR/AUD manage to hold above the recent swing lows, bulls could seek setups in anticipation of a cheeky rebound towards the monthly pivot point.
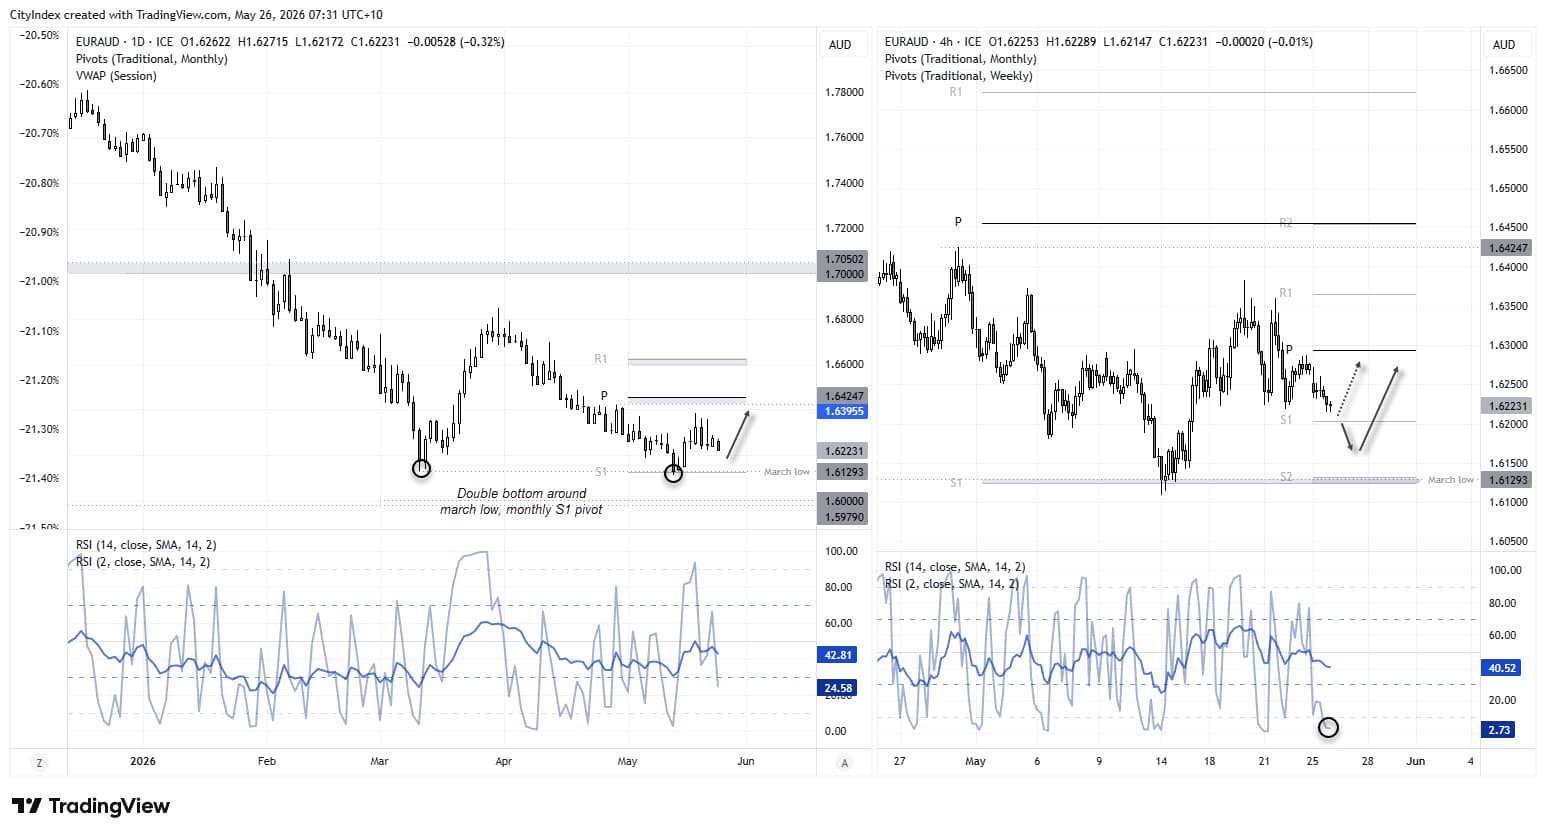
Source: ICE, TradingView
View the full economic calendar
View the full economic calendar
-- Written by Matt Simpson
Follow Matt on Twitter @cLeverEdge
How to trade with City Index
You can trade with City Index by following these four easy steps:
- Open an account, or log in if you’re already a customer
• Open an account in the UK
• Open an account in Australia
• Open an account in Singapore
- Search for the market you want to trade in our award-winning platform
- Choose your position and size, and your stop and limit levels
- Place the trade
Latest market news



Open an account in minutes
Experience award-winning platforms with fast and secure execution, and enjoy tight spreads from 0.5 pts on FX and 0.3 pts on indices.
Economic calendar
Web Trader platform
Our sophisticated web-based platform is packed with features.
Related articles
Fed, DXY, EUR/USD, GBP/USD, USD/CAD, Gold Weekly Technical Outlook 10 26 2026
Sr. Technical Strategist Michael Boutros highlights the levels that matter on the USD Majors, commodities, and equity indices charts this week.
EUR/USD Update: Euro Weakness Returns Ahead of Central Bank Decisions
A new trading week is underway and the euro continues to show signs of weakness in the short term. This can be seen in the recent performance of EUR/USD, which has fallen nearly 0.5% over the last three trading sessions, reflecting a relatively consistent loss of momentum in the European currency.

Crude Oil Weekly Outlook: Elections Test Brent–WTI Resistance Levels
Crude Oil Weekly Outlook: Brent–WTI spread tests long-term resistance as monthly RSI reaches overbought territory and key elections approach. Brent and WTI levels and risks ahead.

This report is intended for general circulation only. It should not be construed as a recommendation, or an offer (or solicitation of an offer) to buy or sell any financial products. The information provided does not take into account your specific investment objectives, financial situation or particular needs. Before you act on any recommendation that may be contained in this report, independent advice ought to be sought from a financial adviser regarding the suitability of the investment product, taking into account your specific investment objectives, financial situation or particular needs.
StoneX Financial Pte. Ltd., may distribute reports produced by its respective foreign entities or affiliates within the StoneX group of companies or third parties pursuant to an arrangement under Regulation 32C of the Financial Advisers Regulations. Where the report is distributed to a person in Singapore who is not an accredited investor, expert investor or an institutional investor (as defined in the Securities Futures Act), StoneX Financial Pte. Ltd. accepts legal responsibility to such persons for the contents of the report only to the extent required by law. Singapore recipients should contact StoneX Financial Pte. Ltd. at 6826 9988 for matters arising from, or in connection with the report.
In the case of all other recipients of this report, to the extent permitted by applicable laws and regulations neither StoneX Financial Pte. Ltd. nor its associated companies will be responsible or liable for any loss or damage incurred arising out of, or in connection with, any use of the information contained in this report and all such liability is hereby expressly disclaimed. No representation or warranty is made, express or implied, that the content of this report is complete or accurate.
StoneX Financial Pte. Ltd. is not under any obligation to update this report.
Trading CFDs carries a high level of risk that may not be suitable for some investors. Consider your investment objectives, level of experience, financial resources, risk appetite and other relevant circumstances carefully. The possibility exists that you could lose some or all of your investments, including your initial deposits. If in doubt, please seek independent expert advice. Visit www.forex.com/en-sg/terms-and-policies for the complete Risk Disclosure Statement.