



USD/JPY Short-Term Bullish But is a 160 Break Possible?
The dual intervention was more than two months ago and since we’ve heard multiple comments from both the US and Japan to try to guide the USD/JPY spot rate lower. Markets appear to be calling that bluff.
Share this:

USD/JPY Talking Points:
- USD/JPY continues to catch bids after pullbacks but bulls remain trepidatious at or around prior highs.
- This has built an ascending triangle formation and this puts even more emphasis on the CPI report later this week. CPI has been a significant driver in the USD/JPY carry trade over the past five years, delivering some of the largest moves – in both directions.
With hindsight perhaps the comments from US Treasury Secretary Scott Bessent were ill-timed. The day he said that “I am the house, bet against me if you want” marked a higher-low in USD/JPY, and since then the pair has gained more than 500 pips. That was on September 9th, and in the month since the USD/JPY pair has shown respectable bullish price action, and if it weren’t for a series of comments from President Trump, Bessent and the Japanese Finance Minister, USD/JPY may well be back above the 160.00 handle, at this point.
I have long said that if the pair is going to reverse for anything more than a pullback, there’s going to need to be some help from data. And we can see this in the history of USD/JPY, where interventions or threats thereof might be able to stall a trend – but for buyers to actually sell out of positions there needs to be some legitimate fear of a change in the underlying backdrop.
And this really speaks to the nature of the situation, where comments saying that the USD/JPY spot rate do not reflect fundamentals. Because the fact is – they do, and it does, and so far markets have seen through threats and buyers haven’t been compelled to close out of longs.
But – if there’s one data item that has consistently been able to create that counter-trend movement, it’s been US CPI, as we can see from some of the larger reversals in the pair over the past four years.
USD/JPY Weekly Chart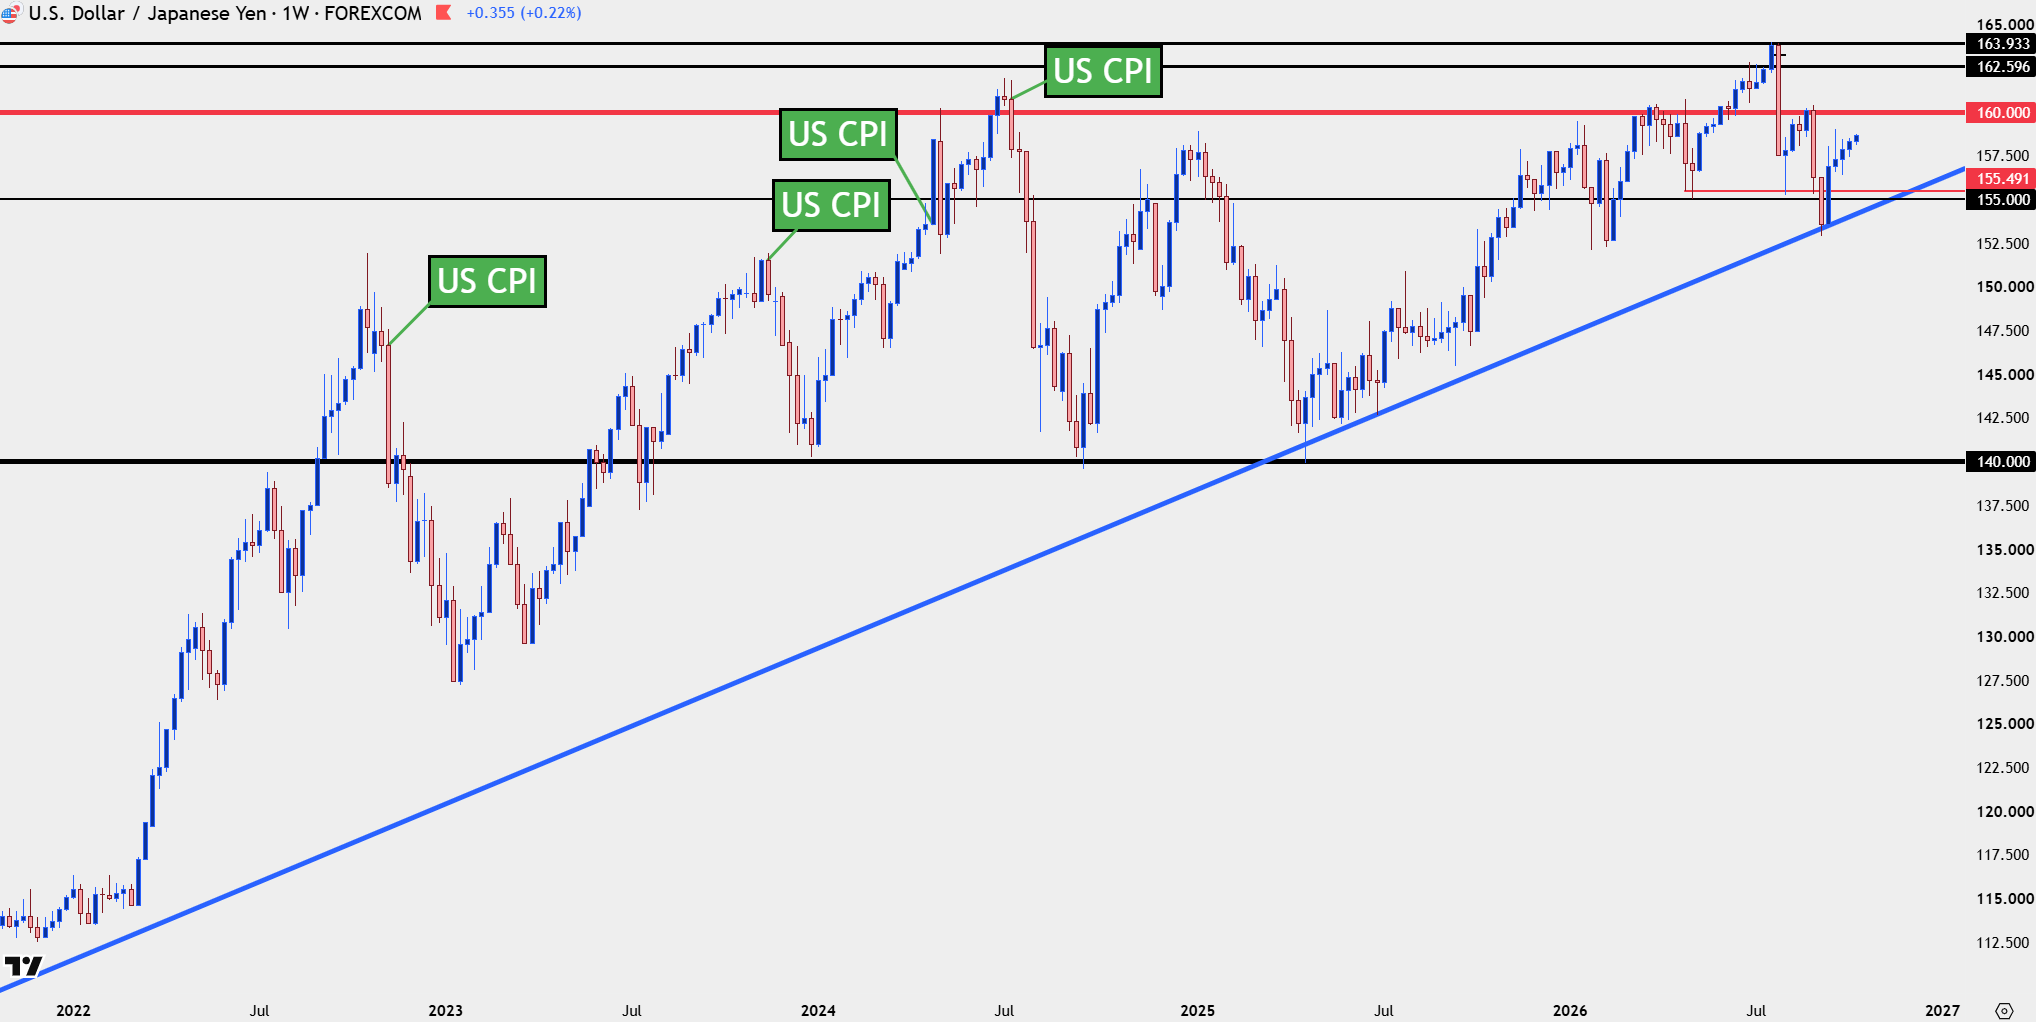
Chart prepared by James Stanley; data derived from Tradingview
The Crux of the Problem
Inflation has printed at 1.9% for Japan over the past two months. The Bank of Japan hiked rates anyways in September despite inflation being below their target. This is quite abnormal for a bank that tested some very experimental monetary policy while consistently leaning more and more dovish.
And one look at the demographic scenario in Japan and it makes sense as to why. With an aging and dwindling population, growth is already an uphill battle, and after decades of disinflation and deflation – much of which was pushed along by a strong Yen – the political volatility in the country pushed economics as a priority. It’s just, an uphill battle when you’re dealing with a population expected to decrease by a third over the next 30ish years.
But, when the comment is made that the spot price doesn’t reflect fundamentals, that’s what speaks against it – inflation in the US remains higher, rate expectations are more hawkish in response to that inflation, and frankly, there’s still a carry trade in play with the rate disparity between the two nations.
And if a fund or a bank is borrowing capital in Japan at lower rates, and then investing elsewhere, the primary risk is currency risk as a continually weakening Yen could eviscerate any profits seen from the spread. So, hedging that risk makes sense and this is where a long USD/JPY trade can come into play.
When that hedge looks more likely to lose capital – such as a large change in underlying inflation rates, such as we saw from the US in November of 2022 or 2023, or July of 2024; or perhaps a jump in inflation such as what we saw in April of 2024 – market participants are going to factor that in.
It’s the very essence of responding to and incorporating fundamentals. But with seemingly everyone pushing in one singular direction, these trades can become incredibly crowded, and that perhaps acts as a magnifier of sorts, so that when some form of change does show, the result can seem more outsized than normal.
USD/JPY Weekly Chart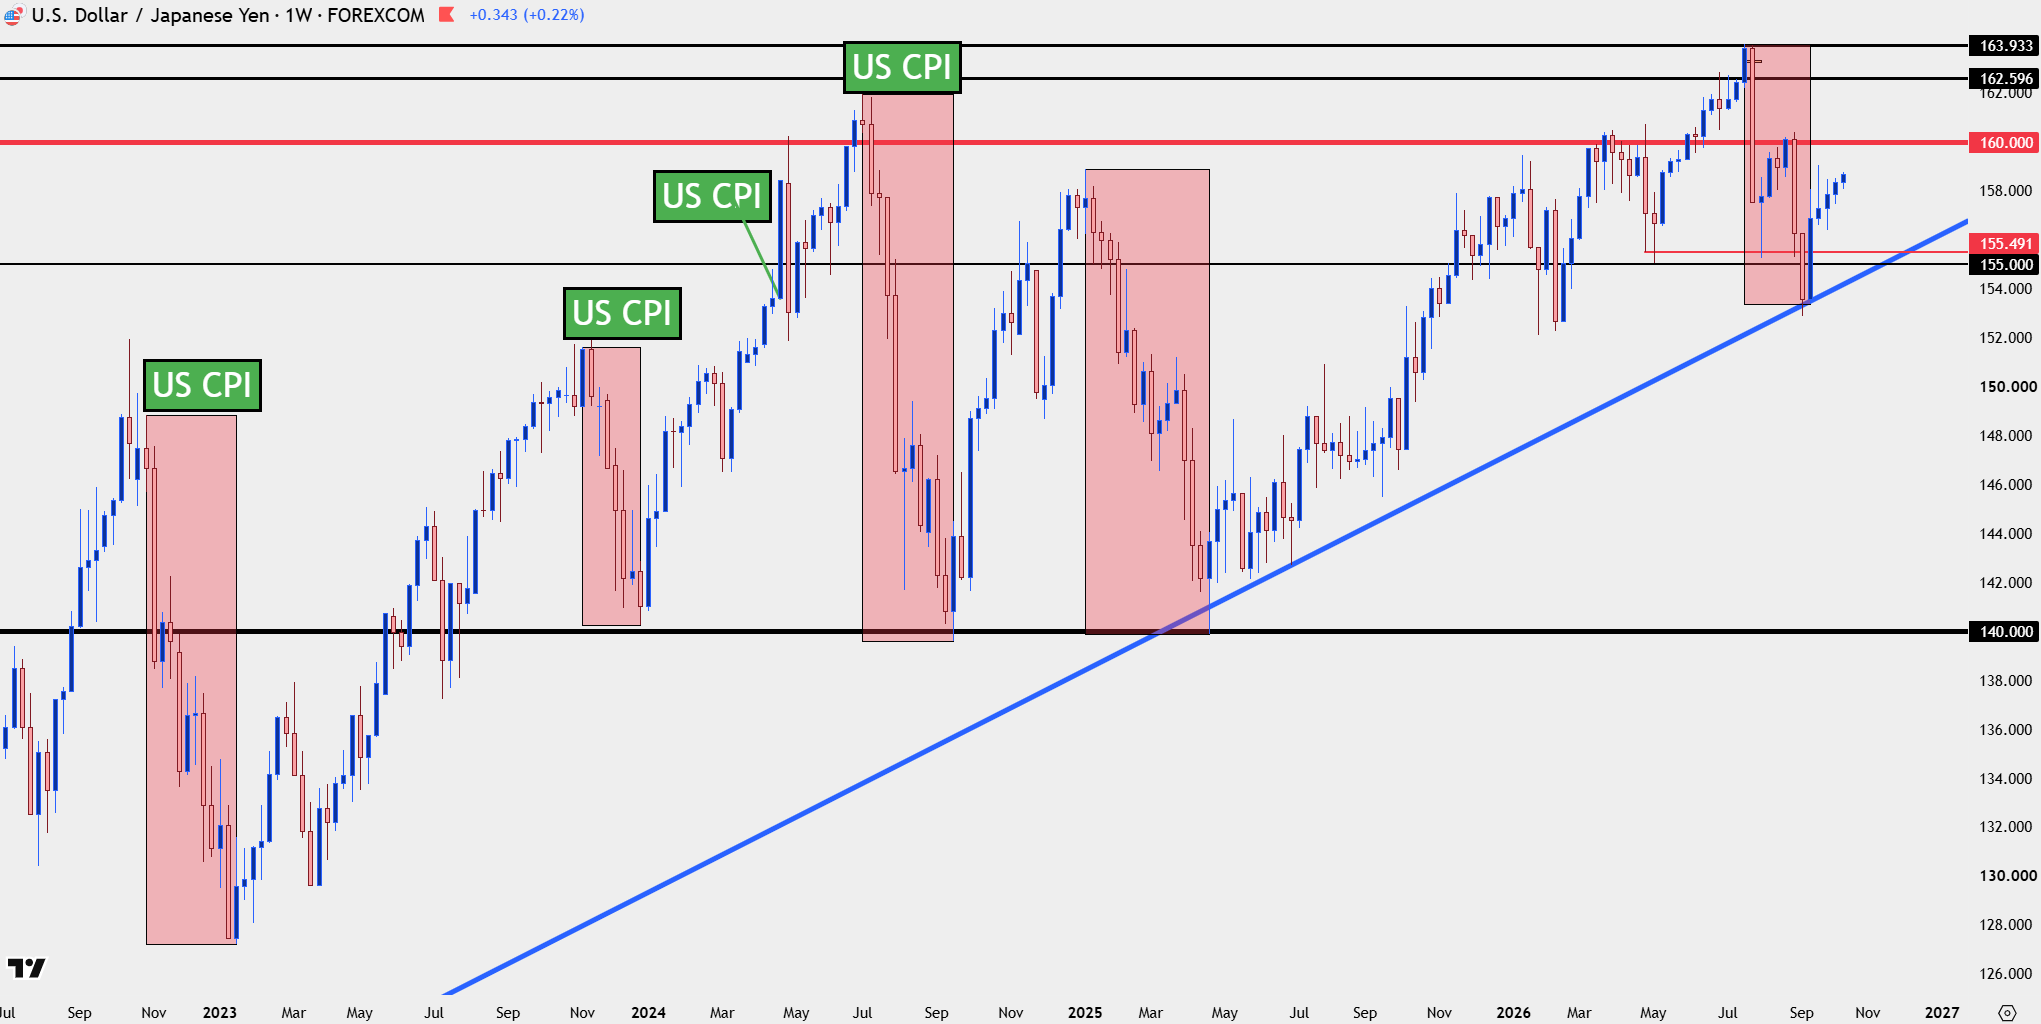
Chart prepared by James Stanley; data derived from Tradingview
Interventions
Interventions in the open market are not ideal, nor should they be. It essentially involves the central bank jumping in to manipulate a free market, using their own cash reserves, to influence a trade in the opposite direction that their own monetary policy is encouraging. Part of the design is to shake out the crowded trades as looked at above, but, in reality, the half life of these moves is often limited in scope. Because, after all, the fundamental backdrop that produced the situation in the first place very much remains in place.
What makes the most recent episode as unique is who is involved, as this time, it was a dual intervention with both the US and Japan taking part. Also unique is the fact that the US Treasury Secretary behind the push has extensive experience in currency markets. Yes, that same Scott Bessent who is currently being called out by markets and social media for his “I am the house” quote. He was a key member of Quantum and the George Soros team that broke the Bank of England in 1992. Bessent’s role at Quantum was executing FX trades and in this most recent example of intervention, it was a unique approach of the US Treasury asking the NY Federal Reserve to do a rate check. These normally happened from the Japanese side, which basically involves a very obvious move from the central bank in orchestrating dialog with banks designed to scare them into action. One of these episodes allegedly took place earlier in the year, in January, but the episode in July was far more forceful as Bessent took the next step of getting the US Treasury to actually go out and buy Japanese Yen in the marketplace.
Why would Bessent be so interested in the matter, aside from his obvious history with Foreign Exchange markets? Well in his current role he’s tasked with managing US Treasury debt and there’s a plethora of long-term US debt coming due in the next year. This is part of the reason why yields have scaled so much higher, the thought of that additional supply has driven longs to sell, and many funds are shorting Treasuries in anticipation. Well Japan is the largest national holder of US debt, and if they are to go into markets to intervene by buying JPY against the Dollar, they would probably be selling Treasuries to fund the trade. This means more supply, and higher yields, at a time when Bessent can ill afford such a thing.
This backdrop helps to explain why USD/JPY continues to see so much bullish price action after these pullbacks. Because, frankly, with still positive carry on the long side of the pair, evidence of support sets up an attractive technical backdrop to go with a bullish fundamental bias in the pair.
The problem is the theoretically capped upside given those intervention comments over the past couple of months.
USD/JPY Daily Chart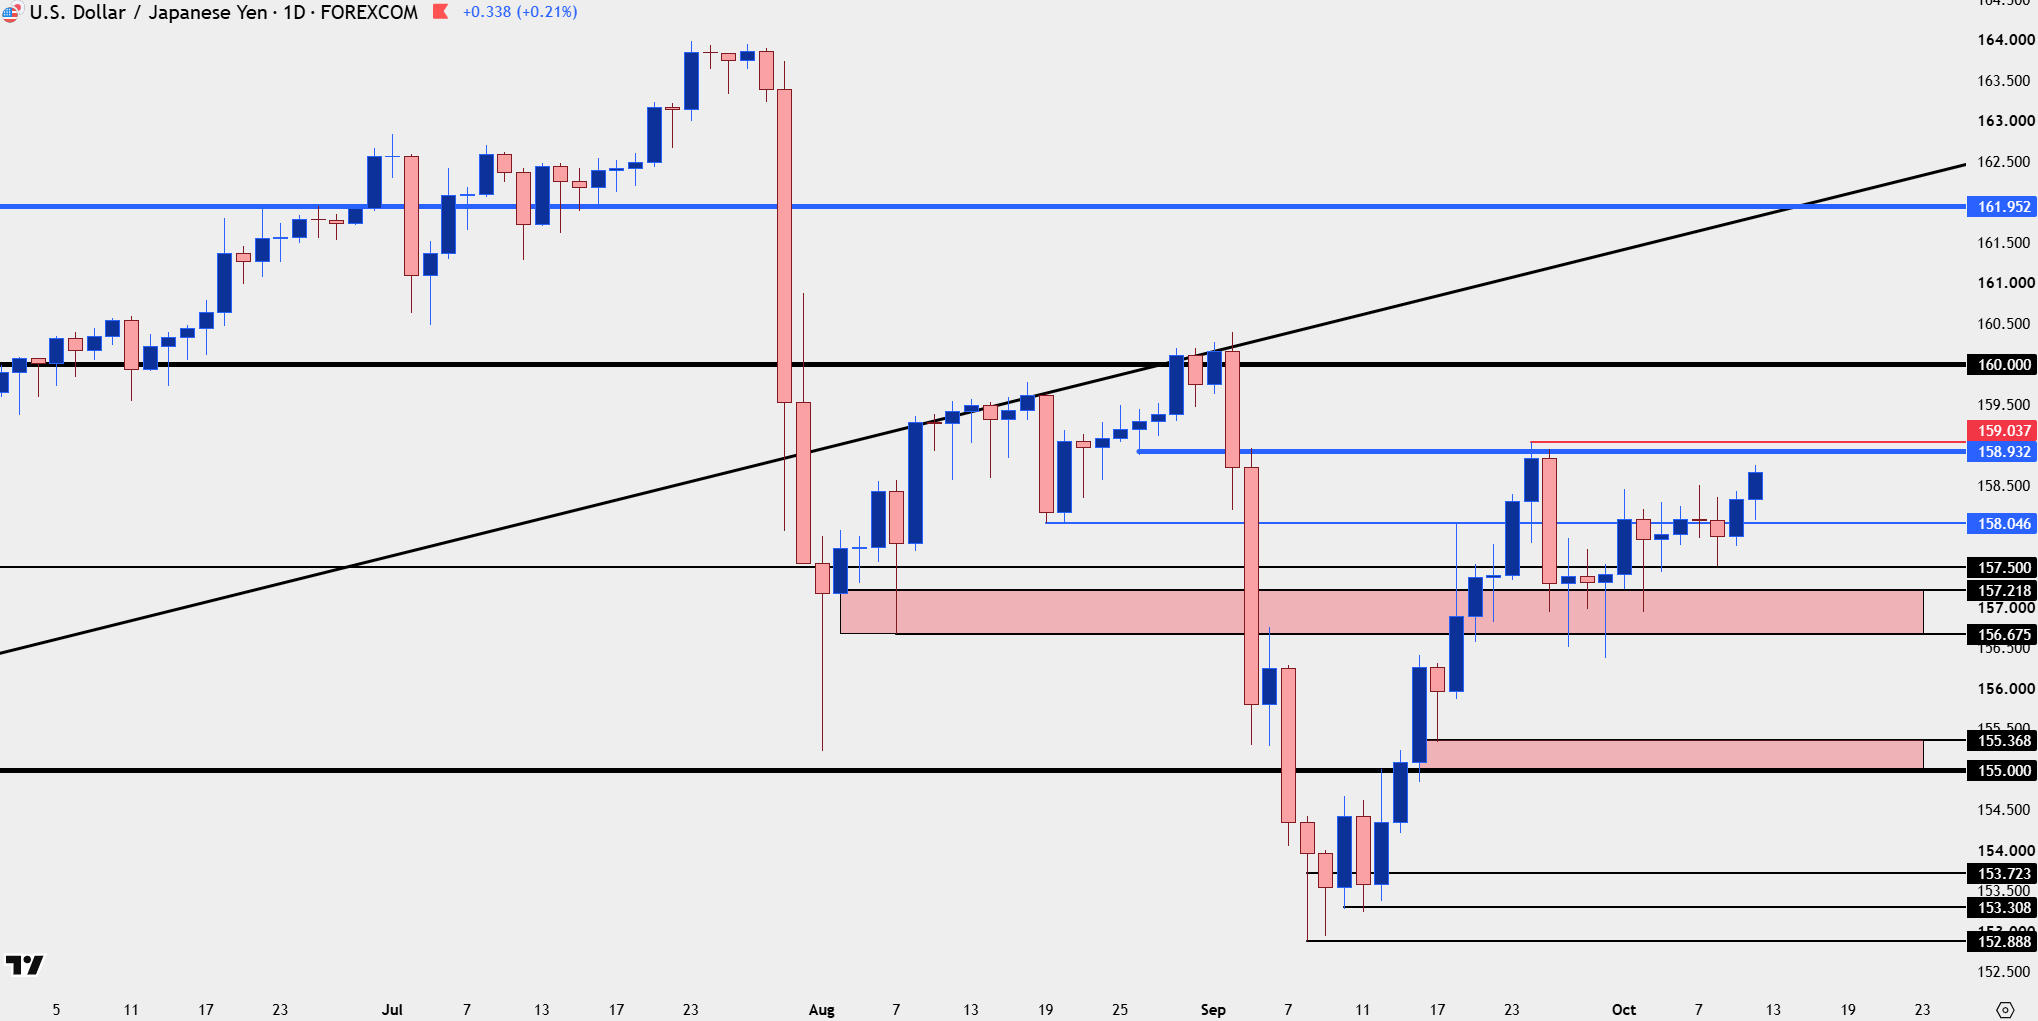
Chart prepared by James Stanley; data derived from Tradingview
USD/JPY Ascending Triangle to the Line in the Sand
The month of August was actuall quite similar to what’s played out since early-September. There’s a series of higher-lows as bulls have gotten more and more aggressive, but there’s also a line-in-the-sand where that bullish price action has suddenly ceased. In August, that line was at 160. More recently, it’s 159.
But notably neither price has seen an actual intervention, as it was merely threats of intervention that pushed prices lower. And this is what sets the stage for CPI on Wednesday as a big print, which would probably push rate hike expectations higher, could compel a breakout in the pair.
The actual hard line in the sand that was defended by action before was 164. But that 160 spot, much like we saw in August as bulls started to tip-toe above, may be vulnerable, as might 159.
On the flip side, a big miss in CPI would hit rate hike expectations and, like we saw back in November of 2022 or 2023, or again in July of 2024, there might be a stampede for the exits as longs look to get out ahead of what would feel like an inevitable pullback.
This puts a lot of emphasis on the CPI print on Wednesday because, after all, fundamentals impact the matter. It’s just perhaps not always in the way that we expect, or the way that some want.
USD/JPY Four-Hour Chart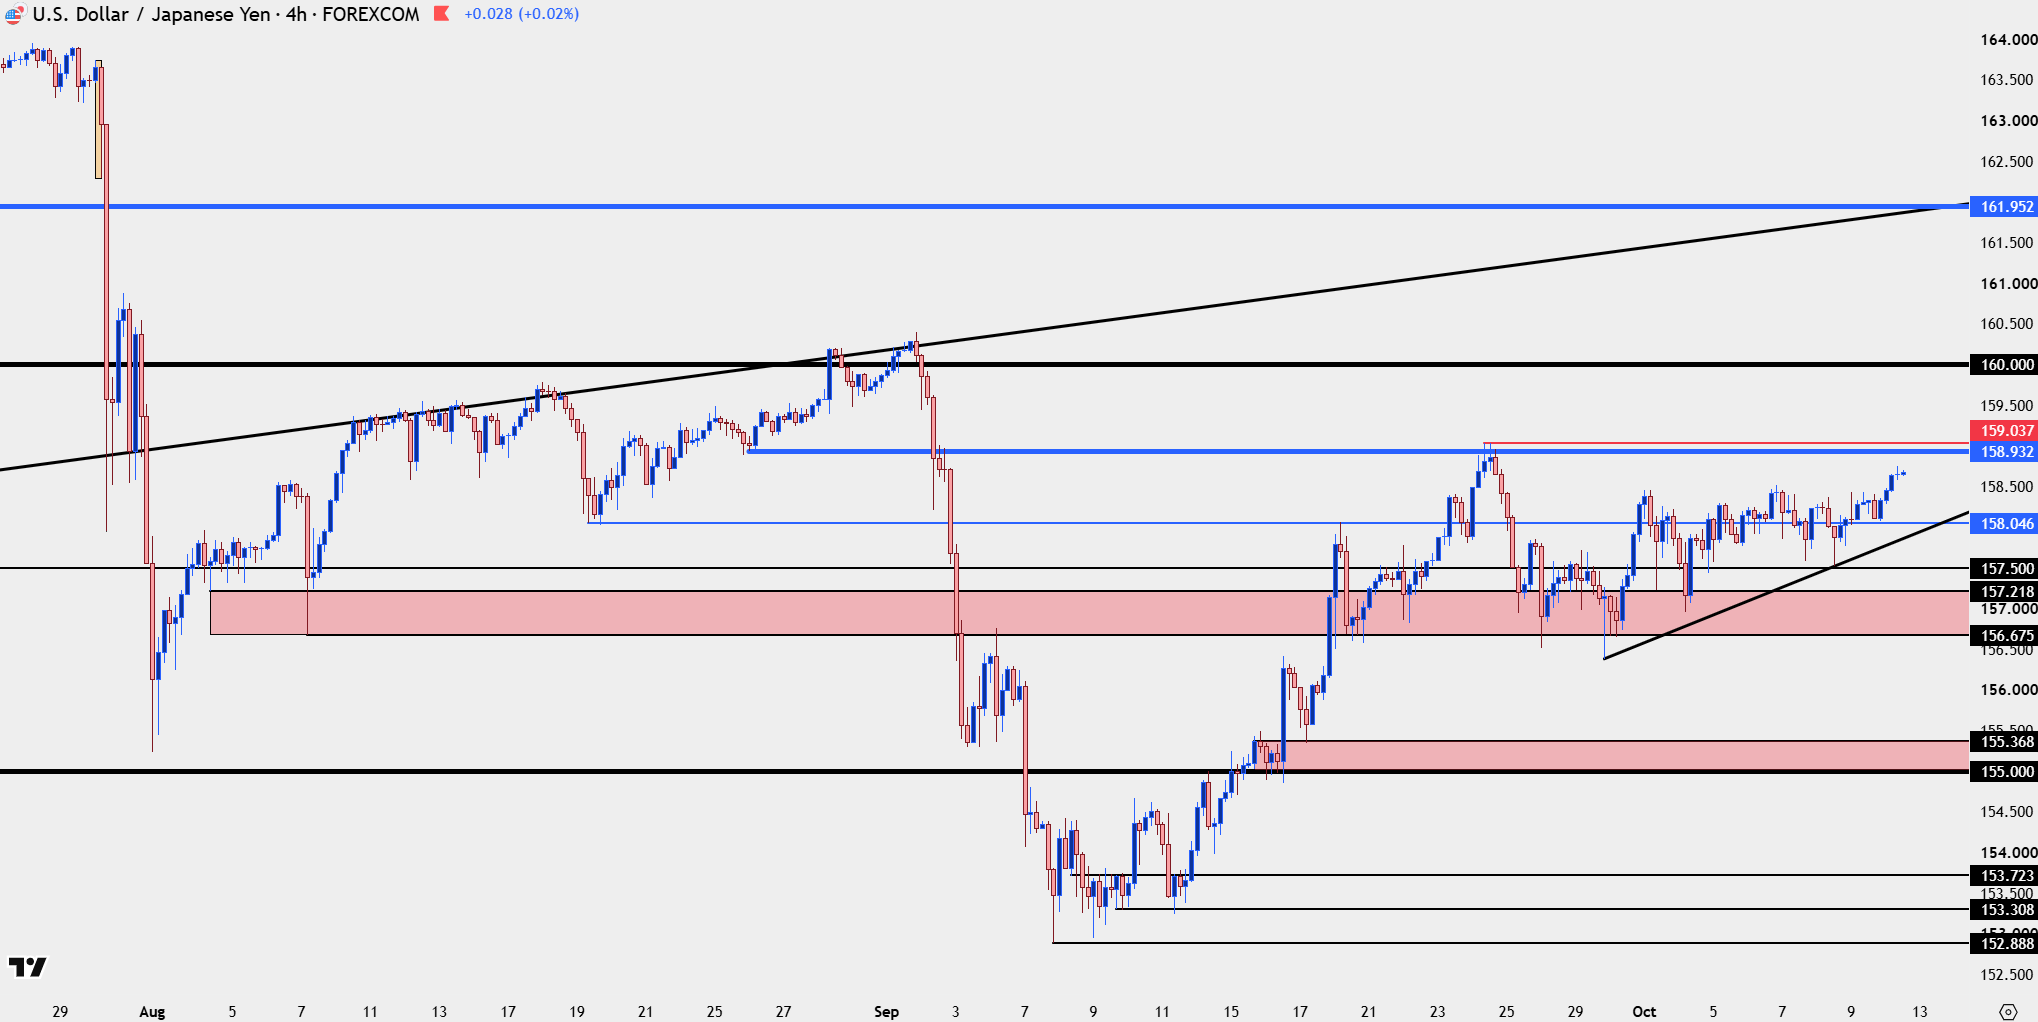
Chart prepared by James Stanley; data derived from Tradingview
--- written by James Stanley, Senior Market Analyst, Global Macro
Related tags:
Latest market news




Open an account in minutes
Experience award-winning platforms with fast and secure execution, and enjoy tight spreads from 0.5 pts on FX and 0.3 pts on indices.
Economic calendar
Web Trader platform
Our sophisticated web-based platform is packed with features.
Related articles
USD/JPY forecast: Dollar remains fundamentally supported ahead of CPI
The USD/JPY eased lower today with the greenback also declining against several other currencies. However, at the time of writing, oil prices were bouncing back and yields were off their lows again. The US dollar hadn’t moved much yet, but these forces could help it to regain its poise ahead of the release of US CPI on Wednesday.

USD/JPY Short-Term Bullish But is a 160 Break Possible?
The dual intervention was more than two months ago and since we’ve heard multiple comments from both the US and Japan to try to guide the USD/JPY spot rate lower. Markets appear to be calling that bluff.

Silver Slide Tests Trendline Support, $60 Handle
Silver prices have been more than halved since the January high but last week saw a key trendline come into play as bulls grasp to hold the $60 handle for the metal.
This report is intended for general circulation only. It should not be construed as a recommendation, or an offer (or solicitation of an offer) to buy or sell any financial products. The information provided does not take into account your specific investment objectives, financial situation or particular needs. Before you act on any recommendation that may be contained in this report, independent advice ought to be sought from a financial adviser regarding the suitability of the investment product, taking into account your specific investment objectives, financial situation or particular needs.
StoneX Financial Pte. Ltd., may distribute reports produced by its respective foreign entities or affiliates within the StoneX group of companies or third parties pursuant to an arrangement under Regulation 32C of the Financial Advisers Regulations. Where the report is distributed to a person in Singapore who is not an accredited investor, expert investor or an institutional investor (as defined in the Securities Futures Act), StoneX Financial Pte. Ltd. accepts legal responsibility to such persons for the contents of the report only to the extent required by law. Singapore recipients should contact StoneX Financial Pte. Ltd. at 6826 9988 for matters arising from, or in connection with the report.
In the case of all other recipients of this report, to the extent permitted by applicable laws and regulations neither StoneX Financial Pte. Ltd. nor its associated companies will be responsible or liable for any loss or damage incurred arising out of, or in connection with, any use of the information contained in this report and all such liability is hereby expressly disclaimed. No representation or warranty is made, express or implied, that the content of this report is complete or accurate.
StoneX Financial Pte. Ltd. is not under any obligation to update this report.
Trading CFDs carries a high level of risk that may not be suitable for some investors. Consider your investment objectives, level of experience, financial resources, risk appetite and other relevant circumstances carefully. The possibility exists that you could lose some or all of your investments, including your initial deposits. If in doubt, please seek independent expert advice. Visit www.forex.com/en-sg/terms-and-policies for the complete Risk Disclosure Statement.