



Nasdaq Rips, 8% Off the Lows – Are Bulls Back in Control?
The AI trade is getting a push this morning following the earnings results from Coreweave, and with the Nasdaq already up more than 8% from last week’s lows the big question is whether a low is in place.
Share this:

Nasdaq Talking Points:
- Last week produced a rare event with the Nasdaq 100 going into oversold territory on the daily chart for the first time since April of last year.
- The index is trading through a massive spot of support-turned-resistance this morning and that sets the stage for a re-test of the 29k level that held the highs last week in Nasdaq futures.
I looked into this coming into the week, as both the Nasdaq 100 and NVDIA pushed into oversold conditions on the daily chart. And for two markets and trades that have been ripping with aggression, that’s become a rare event, and the last time that happened for either was back in April of 2025. Of course, at the time, there was fear of the tariff tantrum, driven by the thought that President Trump was going to press tariffs even as equities began to sell-off. That, of course, didn’t play out, as it was around those April lows that Trump ultimately softened on tariff implementation and, in-turn, stocks jumped.
Our current episode is a bit different, however. To be sure, there is a lever that Trump has some element of control over with Iran and the impact on oil prices, but perhaps more to the point, it’s the fear of a bursting AI bubble, driven by higher US Treasury rates that has taken over headlines and this is a factor that President Trump doesn’t have as much control over. Unless, of course, he wanted to institute some element of austerity which would be a challenge given recent election results.
Nonetheless, as I’ve been highlighting in videos for StoneX, I don’t think this is the bursting of the bubble at this stage as there’s simply to enough pressure to continue forced selling whilst at lows. And, sure enough, it was after stocks pushed into oversold territory that we saw buyers show up, and this further highlights how unless there’s some overriding reason for selling while oversold or while at lows, we can simply see that bullish response that’s become so customary in US equity markets.
This content was created by an affiliate of FOREX.com and represents the views and opinions of the author/speakers, not the views and opinions of FOREX.com, StoneX Group Inc., or its subsidiaries. The content has not been independently reviewed by FOREX.com.
At this point, the Nasdaq is bouncing from a huge level, and I talked about this two weeks ago before the break down in that week’s Top 5 Charts video. This was resistance twice, back in October of last year and then in January of this year, and it’s now shown up for support.
Nasdaq 100 Weekly Chart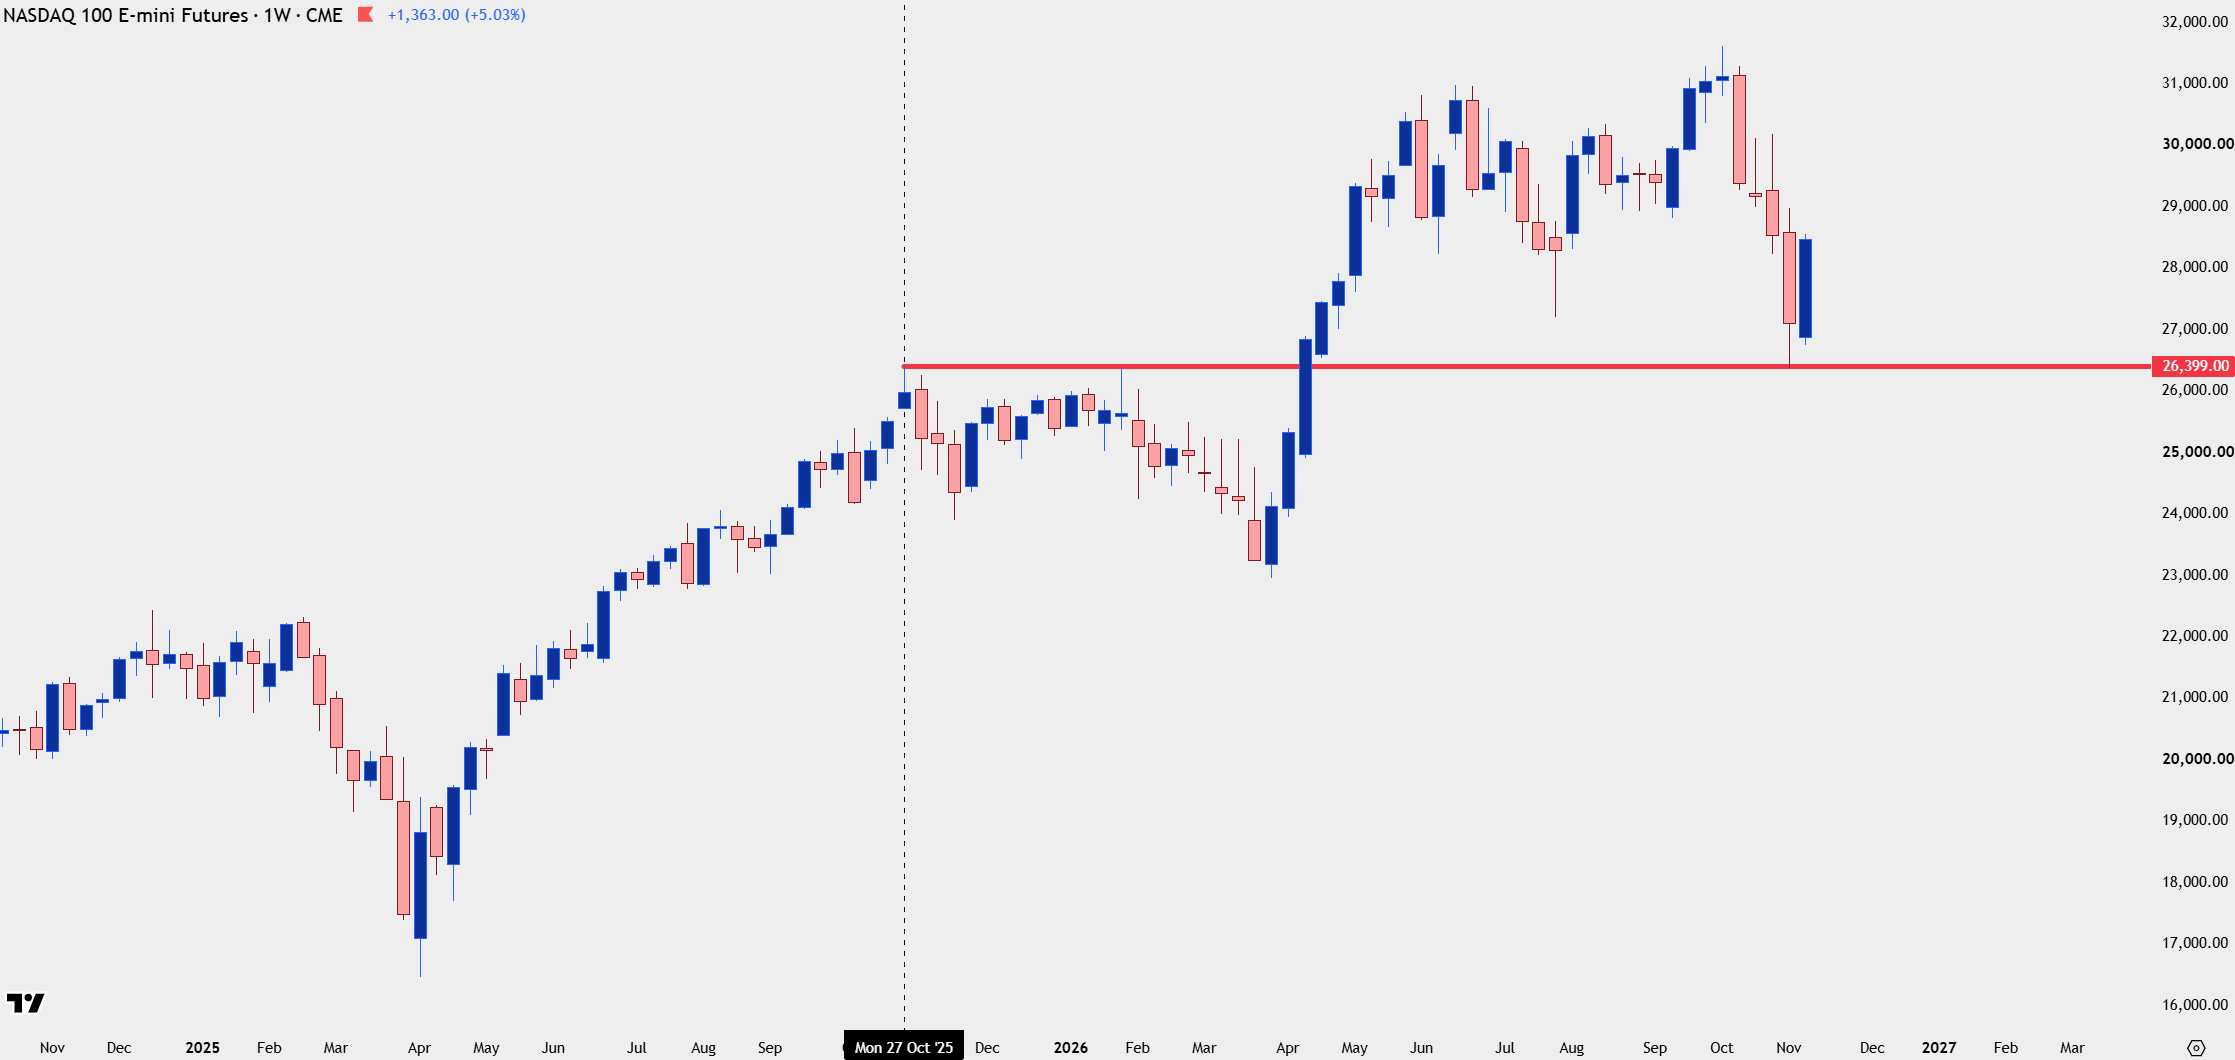
Chart prepared by James Stanley; data derived from Tradingview
Nasdaq Current Test
At this point NQ is grinding through a spot of prior support around the 28,310-28,391 area and this and held the lows back in May. But perhaps the more notable area is the resistance that set in last Thursday before the sell-off into oversold took over, and that plots right around the 29k area. If bulls can get above that, the next major zone is the 30k spot that held resistance twice in late-October.
Nasdaq 100 Daily Chart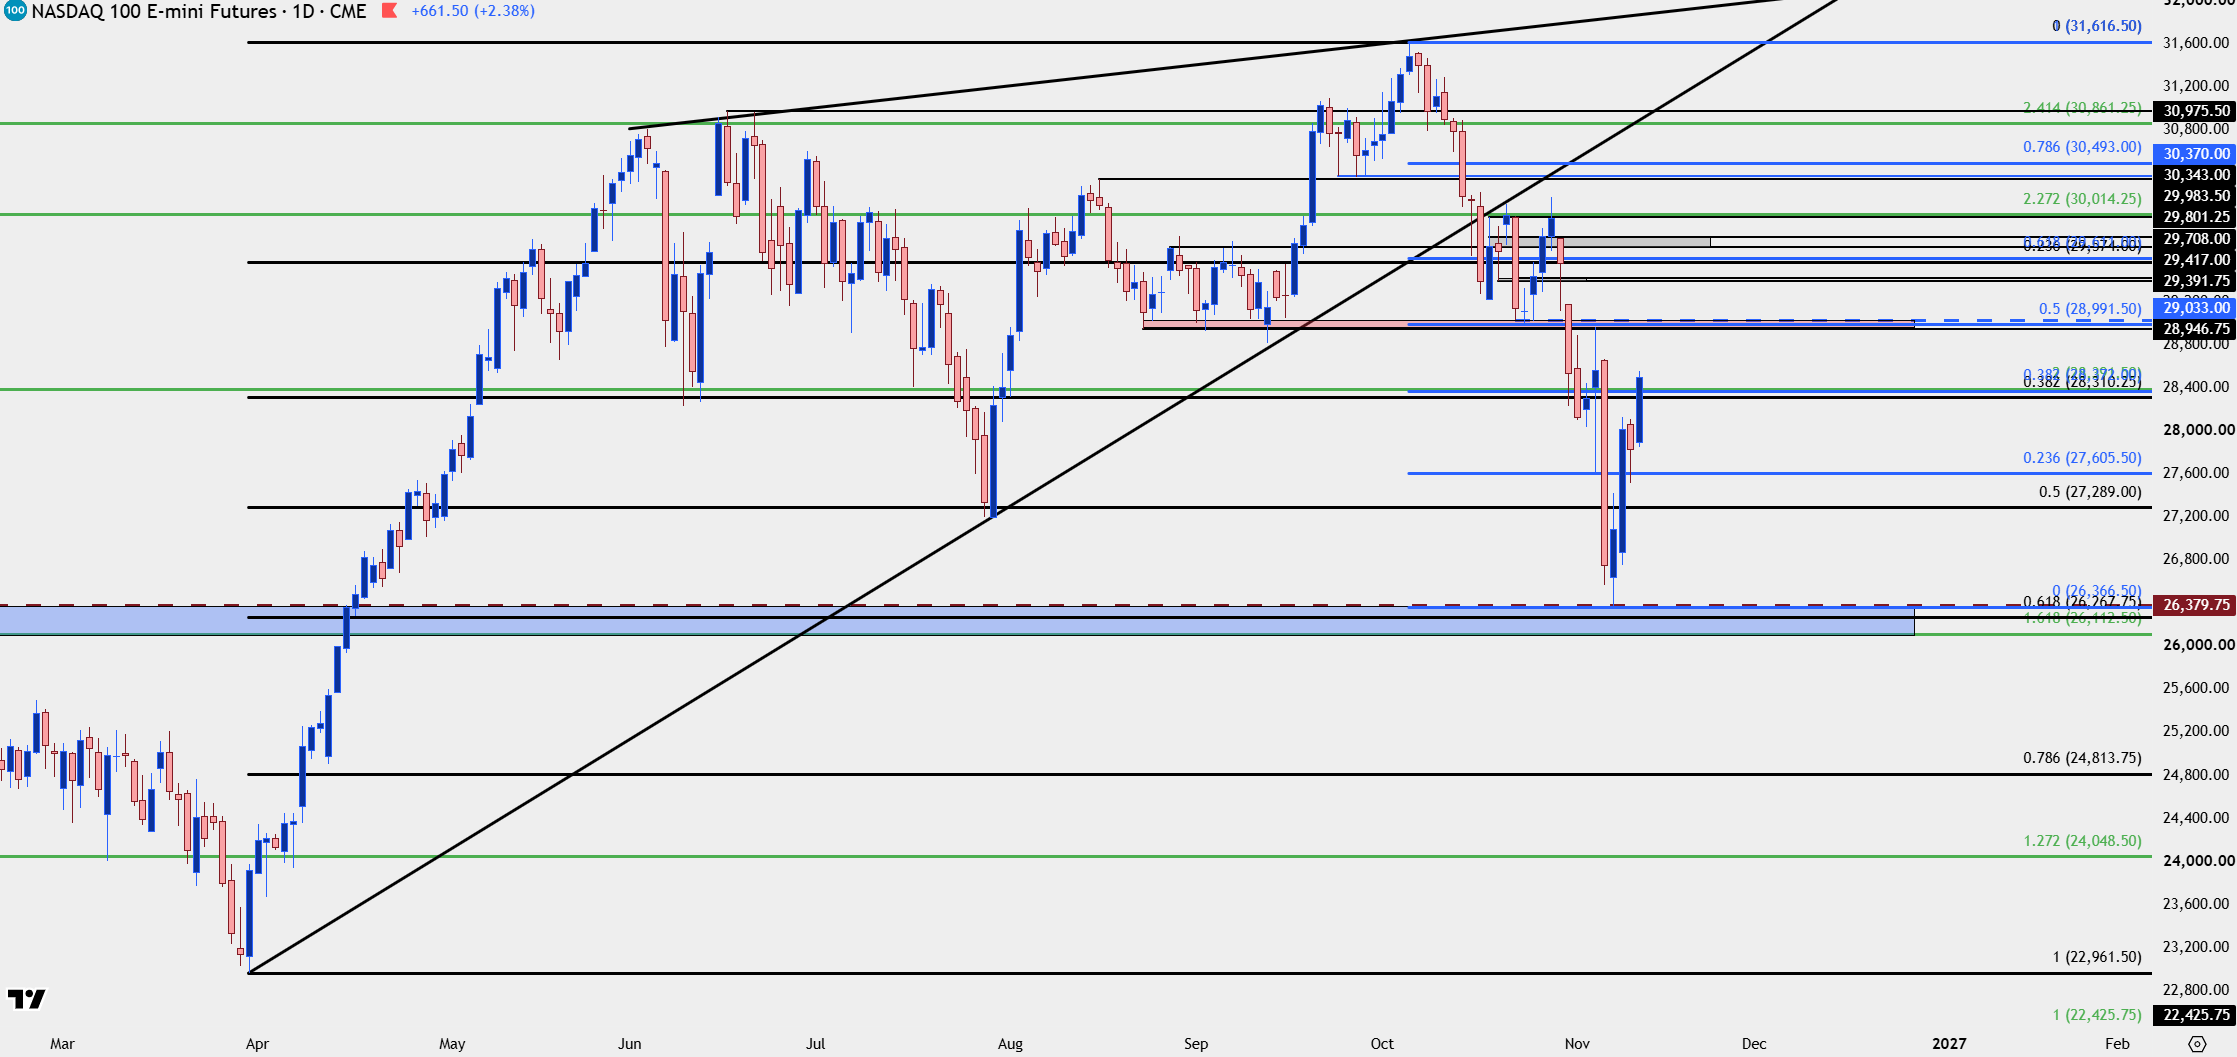
Chart prepared by James Stanley; data derived from Tradingview
Nasdaq: Now’s the Test
Whether this is a bear market rally or a resumption of prior trend will avail itself in the coming days.
On a short-term basis, there’s now a higher-high to go along with a higher-low from yesterday, which printed around the 23.6% Fibonacci retracement of the recent sell-off. This sets the stage for re-test around that same 29k area, which now has the 50% marker of that recent bearish move in the same zone that was in-play before. And related, the 38.2% retracement rests in that same 28,310-28,391 zone that was holding as resistance until earlier this morning.
If or when that sequence of higher-highs and lows breaks down, this will begin to look like it was fueled by short-covering. But, for now, traders can look for short-term higher-low support at either 28,310 or 28,129 for bullish resumption.
Nasdaq 100 Four-Hour Chart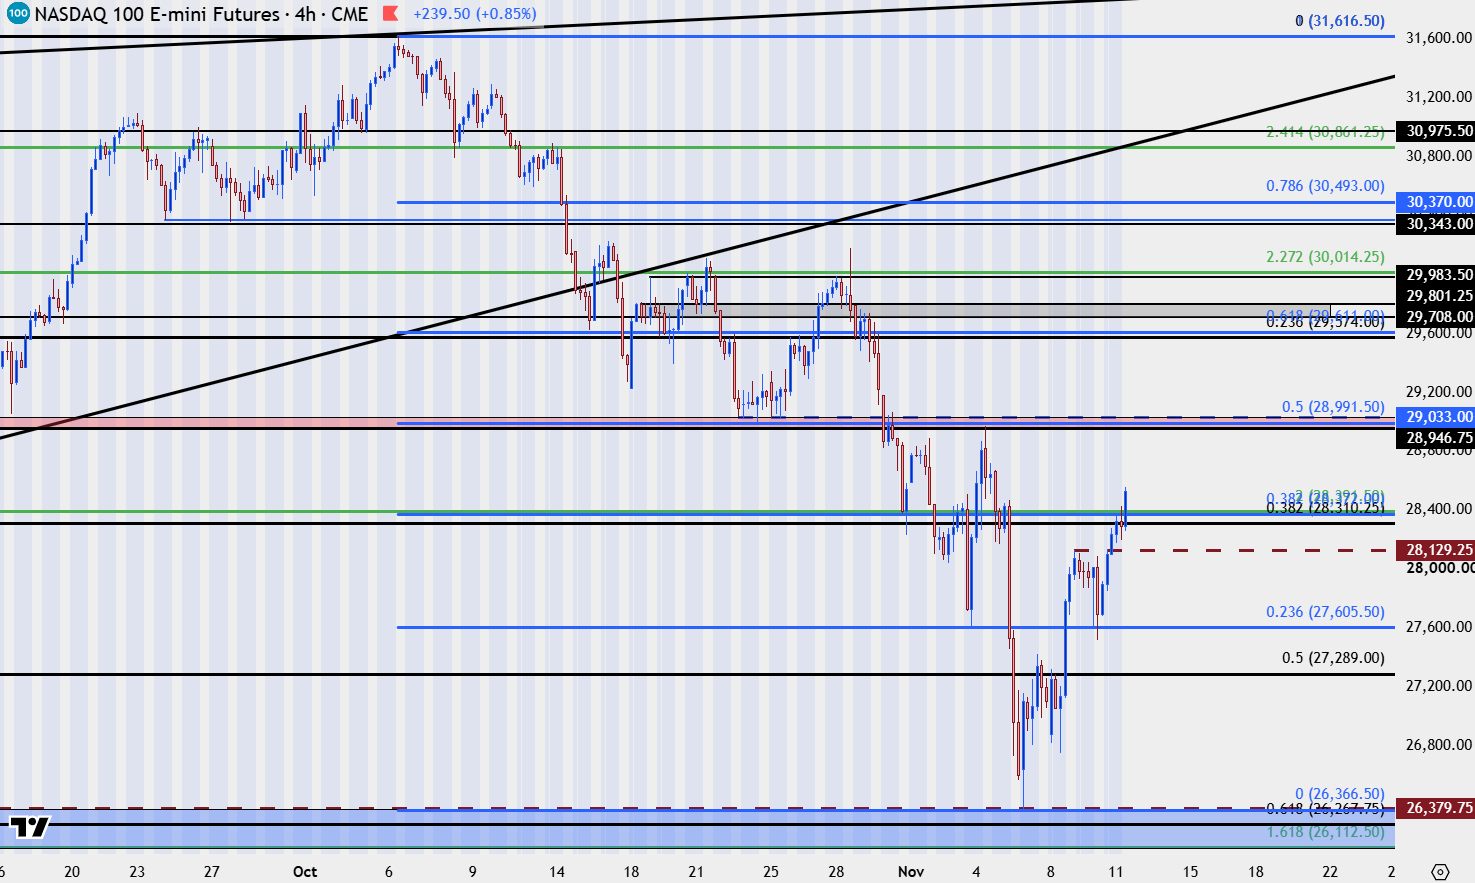
Chart prepared by James Stanley; data derived from Tradingview
--- written by James Stanley, Senior Market Analyst, Global Macro
Related tags:



Open an account in minutes
Experience award-winning platforms with fast and secure execution, and enjoy tight spreads from 0.5 pts on FX and 0.3 pts on indices.
Economic calendar
Web Trader platform
Our sophisticated web-based platform is packed with features.
Related articles

Nasdaq Rips, 8% Off the Lows – Are Bulls Back in Control?
The AI trade is getting a push this morning following the earnings results from Coreweave, and with the Nasdaq already up more than 8% from last week’s lows the big question is whether a low is in place.

Nvidia Holds Support Ahead of Earnings as Nasdaq 100 Rebounds
Nvidia shares approach major support as selling pressure eases, while the Nasdaq 100 rebounds. Could upcoming earnings fuel a broader recovery?


Nasdaq 100 Outlook: Slingshot rally or false dawn?
Nasdaq 100 futures are threatening to reclaim the 200-day moving average following their largest initial breakdown in more than 26 years. History suggests getting back above it is one thing, staying there another.

This report is intended for general circulation only. It should not be construed as a recommendation, or an offer (or solicitation of an offer) to buy or sell any financial products. The information provided does not take into account your specific investment objectives, financial situation or particular needs. Before you act on any recommendation that may be contained in this report, independent advice ought to be sought from a financial adviser regarding the suitability of the investment product, taking into account your specific investment objectives, financial situation or particular needs.
StoneX Financial Pte. Ltd., may distribute reports produced by its respective foreign entities or affiliates within the StoneX group of companies or third parties pursuant to an arrangement under Regulation 32C of the Financial Advisers Regulations. Where the report is distributed to a person in Singapore who is not an accredited investor, expert investor or an institutional investor (as defined in the Securities Futures Act), StoneX Financial Pte. Ltd. accepts legal responsibility to such persons for the contents of the report only to the extent required by law. Singapore recipients should contact StoneX Financial Pte. Ltd. at 6826 9988 for matters arising from, or in connection with the report.
In the case of all other recipients of this report, to the extent permitted by applicable laws and regulations neither StoneX Financial Pte. Ltd. nor its associated companies will be responsible or liable for any loss or damage incurred arising out of, or in connection with, any use of the information contained in this report and all such liability is hereby expressly disclaimed. No representation or warranty is made, express or implied, that the content of this report is complete or accurate.
StoneX Financial Pte. Ltd. is not under any obligation to update this report.
Trading CFDs carries a high level of risk that may not be suitable for some investors. Consider your investment objectives, level of experience, financial resources, risk appetite and other relevant circumstances carefully. The possibility exists that you could lose some or all of your investments, including your initial deposits. If in doubt, please seek independent expert advice. Visit www.forex.com/en-sg/terms-and-policies for the complete Risk Disclosure Statement.