


Gold under the pump as dollar sensitivity surges
Gold's sensitivity to the US dollar is approaching historical extremes, while its reaction to the latest Treasury yield shock ranks among the most severe in decades.
Share this:

- Gold slides beneath the $4,000 level
- Dollar sensitivity approaches historical extremes
- Treasury yield shock triggers unusually severe selling
- Technicals favour downside, putting October lows on radar
Gold is back under the pump, sliding beneath the psychologically important $4,000 an ounce level as renewed US dollar strength and a sharp hawkish repricing of the Fed interest rate outlook weigh on the precious metal. With other high-beta assets, including cryptocurrencies and tech stocks, also struggling, there's a sense that liquidity conditions across markets are tightening, adding further support to the dollar.
And as our analysis shows, that's bad news for gold. Its sensitivity to US dollar movements is approaching historical extremes, resulting in unusually large price swings relative to the currency. While gold continues to hold above the low struck late last month, in such a hostile environment, the risk of that being revisited or exceeded remains elevated.
Gold's dollar beta nears historical extremes
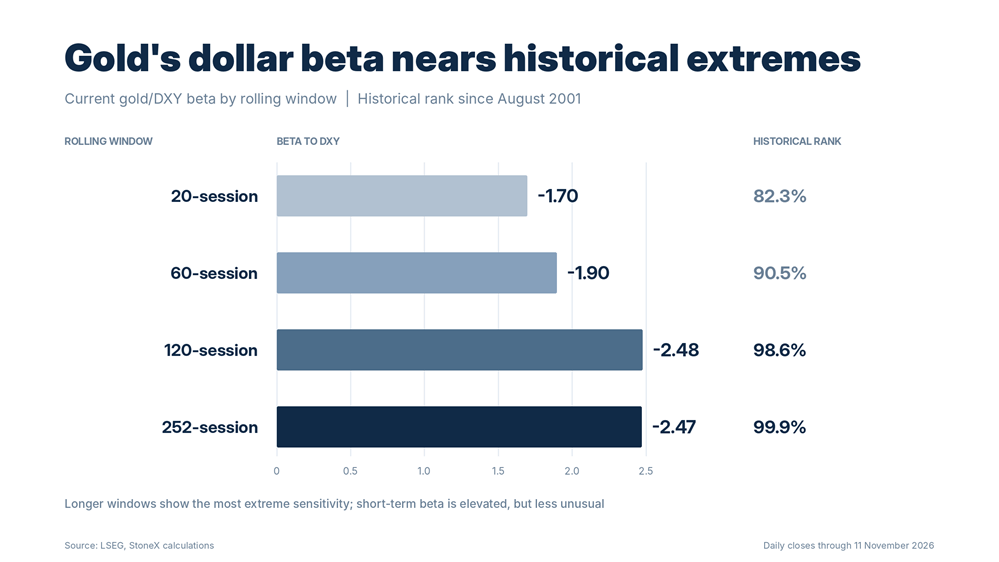
Analysis of daily data going back to 1976 underlines just how sensitive gold has become to movements in the dollar this year. The 252-session beta between gold and the US Dollar Index (DXY) currently stands at -2.47, ranking in the 99th percentile of the entire dataset. In simple terms, that means over the past year, a 1% movement in DXY has been associated with an average movement of just under 2.5% in gold in the opposite direction.
Source: LSEG
While shorter timeframes show less extreme readings, sensitivity to dollar movements remains elevated nonetheless. The 20- and 60-session betas stand at -1.70 and -1.90, ranking around the 84th and 91st percentiles respectively, while the 120-session reading of -2.48 is also historically rare. Even though we haven't seen an exceptionally strong inverse correlation between gold and the dollar over those timeframes, what is clear is that the magnitude of gold's price swings relative to the dollar has been extreme.
Gold's volatility dwarfs that of the dollar
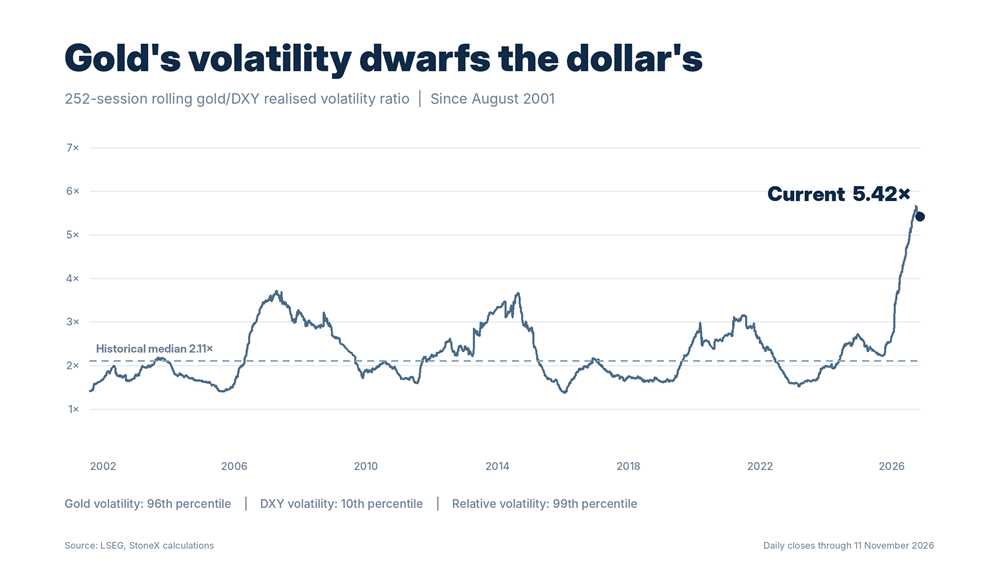
The magnitude of gold's price swings relative to DXY helps explain its unusually high beta this year, with gold approximately 5.42 times as volatile as the dollar over the past 252 sessions, an extremely elevated level compared with the historical median of just 2.08 times.
Source: LSEG
What's behind this abrupt increase in volatility is harder to establish. It could be profit-taking following gold's remarkable multi-year rally, liquidation among those who bought near the record highs, or even tightening liquidity conditions, as hinted at by recent weakness across other speculative assets such as cryptocurrencies and parts of the tech sector.
Gold's reaction to latest rate shock unusually severe
It may also be explained by just how substantial a rate shock the precious metals complex has been exposed to over recent days, with the scale of the magnitude exceeding anything in what has already been a fairly volatile year for US Treasury markets.
Source: LSEG
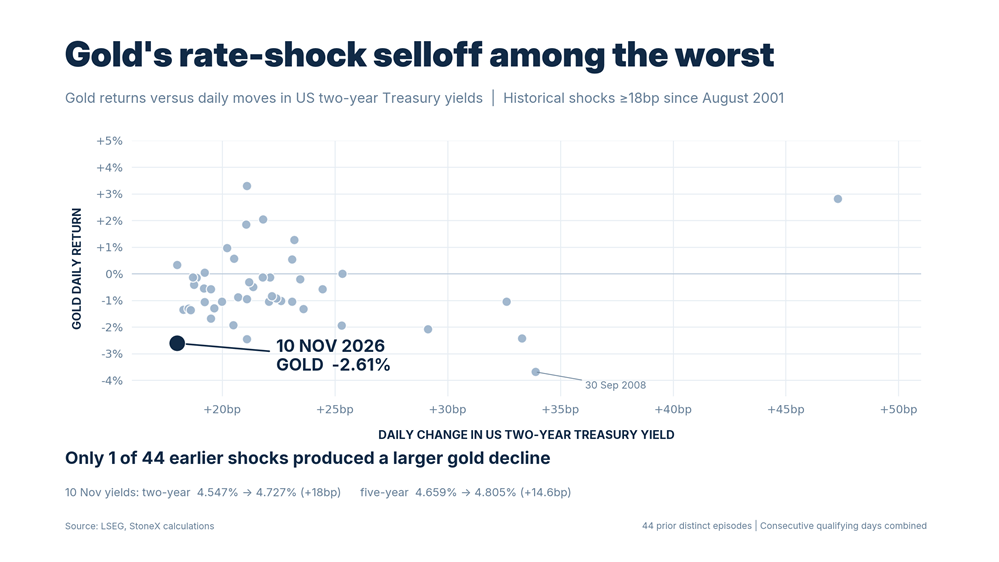
On Tuesday, gold slumped 2.61% as the US two-year Treasury yield jumped 18 basis points, the largest single-session increase of 2026.
Looking at 44 previous distinct episodes since August 2001 when the two-year yield rose by at least 18 basis points in a session, gold declined by an average of just 0.52%. Only one of those episodes produced a larger fall than that seen on Tuesday, highlighting just how sensitive gold has become to movements not only in the US dollar, but also in Treasury yields.
Gold four-hourly technical outlook
Source: TradingView
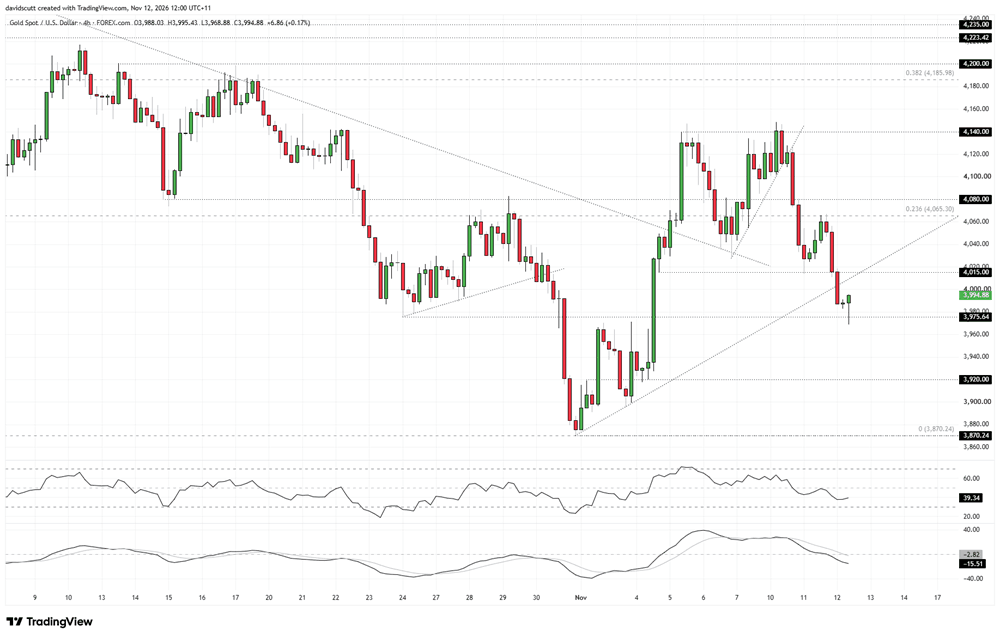
After failing to break above resistance at $4,140, gold's subsequent rebound from $4,015 earlier this week stalled at the 23.6% Fibonacci retracement of the August to November decline near $4,065. Bears regained control, sending gold beneath not only the uptrend from the October 31 low, but also several horizontal supports before the decline eventually stalled at $3,975.64.
While the price is bouncing from that level today amid modest dollar weakness following intervention warnings from Japanese officials, the price action still feels heavy, a view reinforced by oscillators that continue to favour short setups over longs. RSI (14) remains beneath the neutral 50 level, setting lower lows along the way, while MACD has already staged a bearish crossover and moved into negative territory.
As such, traders should be alert for a potential break beneath $3,975. If that occurs, shorts could be considered with a tight stop above the level for protection, initially targeting $3,920, which has acted as support and resistance earlier this month. Below that, $3,900, where the price bounced on two occasions on November 3, comes into view, followed by the October 31 low of $3,870.24. The merits of a short setup would be bolstered by a backtest and rejection of $3,975 following a break beneath it.
On the upside, $4,015 is the first level of note, having previously acted as support and now intersecting roughly with the former uptrend from the October 31 low. Should the rebound underway in Asia extend towards that level and stall, it could provide an alternative entry point for shorts, allowing for a tight stop above $4,015 for protection, initially targeting a retest of $3,975. However, a break back above $4,015 that sticks would call the short-term bearish bias into question, bringing the 23.6% Fibonacci retracement at $4,065 into focus.


Open an account in minutes
Experience award-winning platforms with fast and secure execution, and enjoy tight spreads from 0.5 pts on FX and 0.3 pts on indices.
Economic calendar
Web Trader platform
Our sophisticated web-based platform is packed with features.
Related articles
Gold under the pump as dollar sensitivity surges
Gold's sensitivity to the US dollar is approaching historical extremes, while its reaction to the latest Treasury yield shock ranks among the most severe in decades.

US Dollar Forecast: AUD/USD, Gold, EUR/USD Under Pressure
Could the US dollar rally accelerate? Matt Simpson examines the outlook for DXY, AUD/USD, EUR/USD and gold, plus key technical levels across forex markets.


GBP/USD approaches breaking point as US yields surge
A historic repricing of US interest rate expectations has propelled the dollar higher, leaving GBP/USD testing a crucial support level ahead of UK GDP.
This report is intended for general circulation only. It should not be construed as a recommendation, or an offer (or solicitation of an offer) to buy or sell any financial products. The information provided does not take into account your specific investment objectives, financial situation or particular needs. Before you act on any recommendation that may be contained in this report, independent advice ought to be sought from a financial adviser regarding the suitability of the investment product, taking into account your specific investment objectives, financial situation or particular needs.
StoneX Financial Pte. Ltd., may distribute reports produced by its respective foreign entities or affiliates within the StoneX group of companies or third parties pursuant to an arrangement under Regulation 32C of the Financial Advisers Regulations. Where the report is distributed to a person in Singapore who is not an accredited investor, expert investor or an institutional investor (as defined in the Securities Futures Act), StoneX Financial Pte. Ltd. accepts legal responsibility to such persons for the contents of the report only to the extent required by law. Singapore recipients should contact StoneX Financial Pte. Ltd. at 6826 9988 for matters arising from, or in connection with the report.
In the case of all other recipients of this report, to the extent permitted by applicable laws and regulations neither StoneX Financial Pte. Ltd. nor its associated companies will be responsible or liable for any loss or damage incurred arising out of, or in connection with, any use of the information contained in this report and all such liability is hereby expressly disclaimed. No representation or warranty is made, express or implied, that the content of this report is complete or accurate.
StoneX Financial Pte. Ltd. is not under any obligation to update this report.
Trading CFDs carries a high level of risk that may not be suitable for some investors. Consider your investment objectives, level of experience, financial resources, risk appetite and other relevant circumstances carefully. The possibility exists that you could lose some or all of your investments, including your initial deposits. If in doubt, please seek independent expert advice. Visit www.forex.com/en-sg/terms-and-policies for the complete Risk Disclosure Statement.