



USD/JPY Weekly Outlook: CPI Takes Centre Stage After Payrolls Revive Fed Hike Bets
Intervention innuendo, confused Fed messaging and a hawkish BOJ repricing drove a violent move lower in USD/JPY last week. Strong payrolls stopped the slide, leaving this week’s inflation data to determine whether the rebound sticks.
Share this:

- Suspected intervention helped drive USD/JPY sharply lower
- September BOJ hike now fully priced
- Payrolls revived September Fed hike expectations
- CPI and PPI dominate this week’s US calendar.
- USD/JPY moves remains tightly linked to US Treasury yields
USD/JPY suffered its largest weekly loss since late July as we entered September, hit by relatively dovish remarks from senior Fed officials and possible intervention from the Bank of Japan on behalf of the Japanese government.
However, an unusually strong August payrolls report in the United States on Friday managed to resuscitate not only rate hike pricing for the Fed’s meeting the week after next, but also stall what had been an abrupt move lower in the pair.
With a strong and strengthening relationship with gyrations in US bond yields, how the Fed rate outlook evolves this week will likely determine where USD/JPY finishes up on Friday.
Inflation Data Set to Drive Fed Pricing
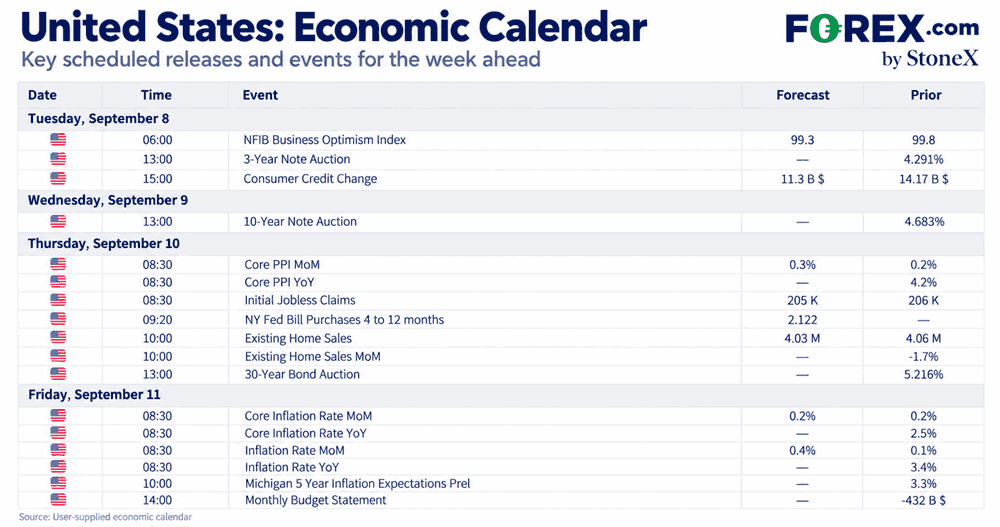
Thursday’s PPI and Friday’s CPI reports stand out as the known knowns most likely to impact USD/JPY this week.
Both will not only help shape expectations for what core PCE may print at later this month, but could go a long way to determining whether the Fed begins a new tightening cycle in September.
Source: TradingView
The timing is especially important given conflicting messages from senior Fed officials over the past week. Chair Kevin Warsh struck a hawkish tone at Jackson Hole, making it clear he remained uncomfortable with inflation and that the Fed still had work to do if price pressures failed to ease sufficiently. Governor Michael Barr also sounded relatively hawkish, reinforcing the sense that another hike remained firmly on the table.
But that messaging was subsequently tempered by New York Fed President John Williams, who said the case for a September hike “isn’t yet firm”, and Governor Christopher Waller, who said he would support keeping rates unchanged if August inflation continued to cool.
With the Fed now in blackout ahead of the September meeting, it will therefore leave the data to do the talking.
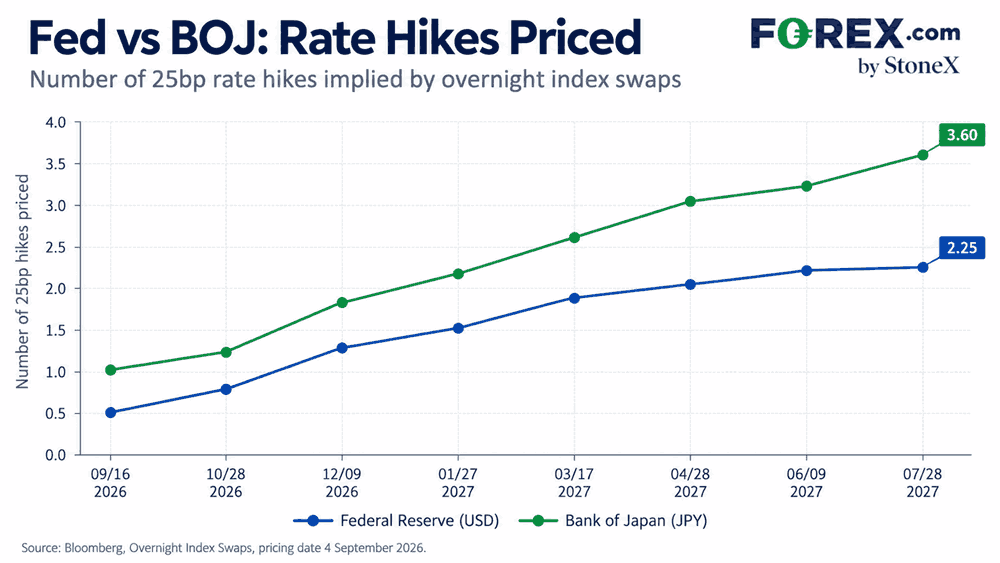
At the very least, the core figures probably need to print in line with expectations, if not a touch above, to really cement the case for a September hike. If that happens, you’d expect market pricing to follow, with the probability of a move currently sitting just shy of two in three.
The underlying detail will also matter, particularly in areas of the economy that are more heavily influenced by domestic factors, such as services inflation excluding housing and energy services.
If the core readings undershoot, market pricing for a September hike would likely ratchet lower, leaving December as the more likely candidate as the Fed and markets have more time to assess incoming economic data.
While history suggests the more volatile market reaction normally comes following CPI, PPI arrives first on this occasion, meaning it could provide markets with a strong steer on whether upside or downside inflation risks are prevalent heading into Friday.
Treasury Auctions Enter the Spotlight
Another area of note on the US calendar will be Treasury supply, with three, 10 and 30-year auctions scheduled across the week. They arrive at a time when there’s already plenty of unease around Fed credibility and the size of the US deficit.
US President Donald Trump’s threat on Friday to impose tariffs on countries if the Fed doesn’t cut rates could, at the margin, dissuade international investors from participating in those auctions.
We also get the Treasury’s monthly budget statement on Friday. If that delivers another ugly deficit print, as we saw in the July figures, it could place renewed upward pressure on Treasury yields.
Contrary to what you might normally expect from renewed fiscal concerns, given the strong positive relationship between USD/JPY and moves in US Treasury yields over recent weeks, any renewed move higher in yields from weak auction demand or another poor budget print could also help generate upside in the pair.
Source: Bloomberg
Japan Data Must Back the Hawkish Shift
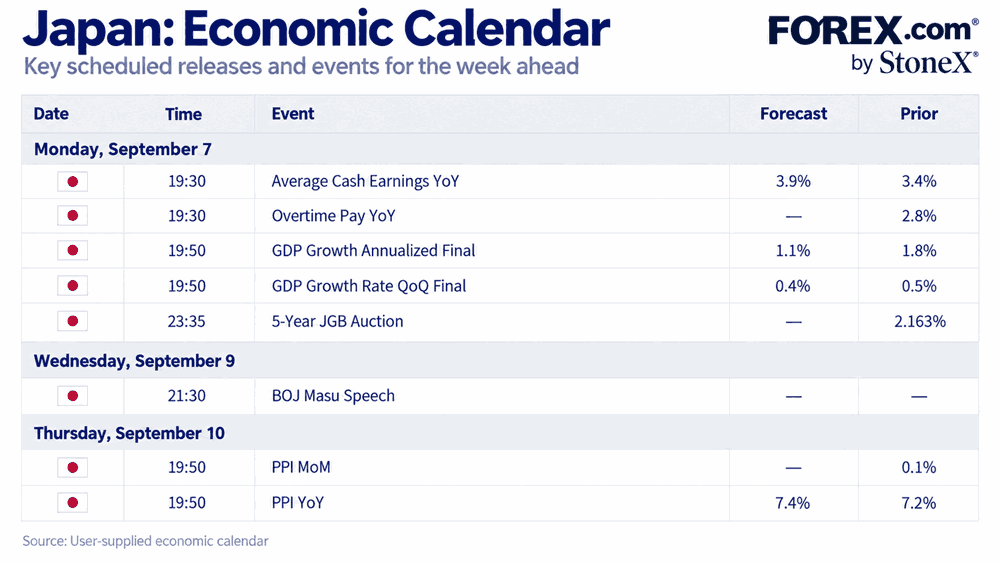
On the Japanese side of the ledger, the impetus to sustain the strengthening in the yen seen last week will come down to key wages and upstream PPI data released during the week.
There’s been a distinct hawkish repricing of the Japanese rates outlook over the past couple of weeks, with a September hike now fully priced and an over 80% probability attached to a follow-up move in December.
Source: TradingView
It will be left to those reports, along with the detail in the final read of Q2 GDP released on Tuesday, to justify those expectations. If we see weakness relative to market expectations, it runs the risk of pushing BOJ policymakers back towards a more cautious stance on the cadence of policy tightening.
The detail in the GDP report will also be important. The initial release was soft beneath the headline, with weakness in household consumption especially prominent.
Even though the report now comes across as a little like ancient history, stronger underlying detail would still help build confidence in the virtuous cycle the BOJ wants to see between strengthening wage pressures, firmer demand and self-sustaining inflationary pressures. At the margin, that will be another important consideration for the rates outlook.
US Rates Link Tightens
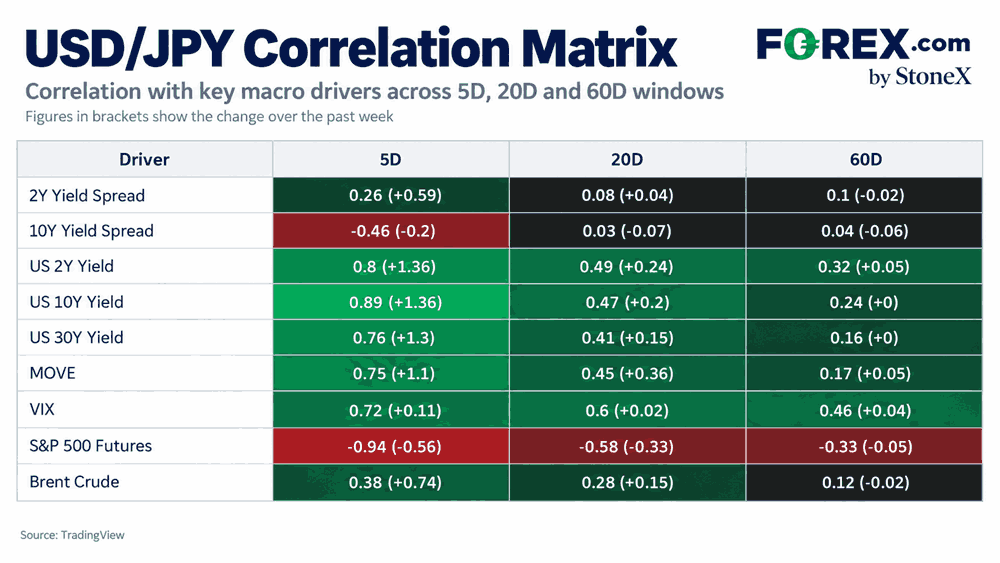
Despite the hawkish repricing of the Japanese rates outlook, the correlation matrix below continues to point to a very strong linkage between USD/JPY and outright movements in US Treasury yields.
Source: TradingView
Over the past five days, the correlation with the US 2-year yield sits at 0.80, rising to 0.89 with the US 10-year and 0.76 with the 30-year. That compares with just 0.26 for the US-Japan 2-year yield spread and -0.46 for the 10-year spread over the same period.
So even though Japan’s rates outlook has undergone quite a major hawkish transition recently, the message from the matrix remains one where the US rates outlook, along with the implications further out the curve, continues to have a vice-like grip on movements in USD/JPY.
It’s also worth pointing out that we’re seeing an unusual positive correlation between USD/JPY and both VIX and MOVE, which is contrary to what you’d normally expect given the yen’s status as a funding currency for carry trades. At the same time, the inverse relationship with risk assets has persisted and strengthened, with the five-day correlation with S&P 500 futures sitting at -0.94.
What’s also notable is that the damage higher energy prices had been doing to the yen appears to have weakened. That relationship had been driven by concerns around Japan’s energy security and the deterioration in its terms of trade, yet the yen managed to strengthen last week even as energy prices continued to rise.
USD/JPY Respects the Range
Source: TradingView
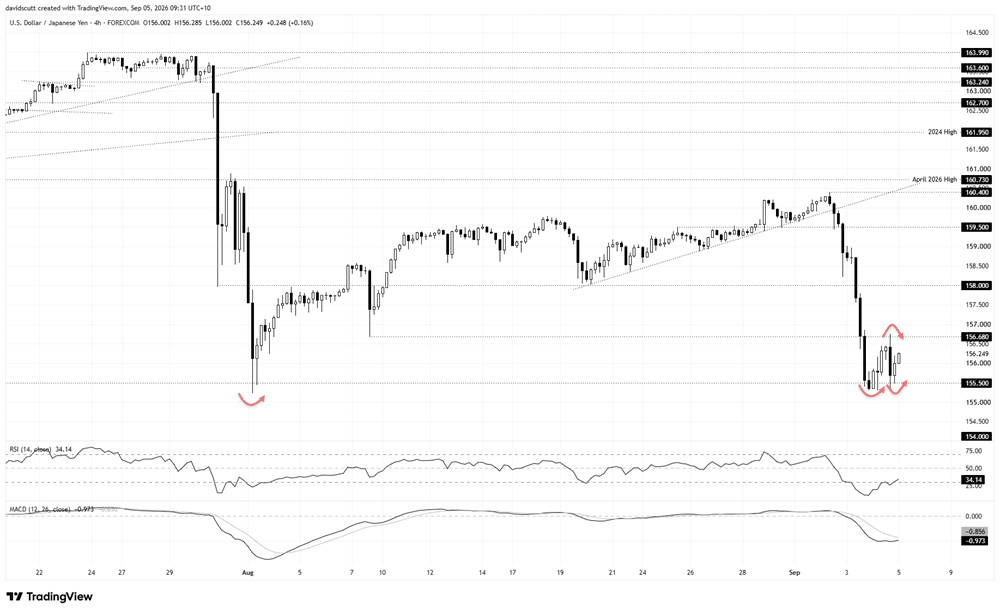
While the question as to whether the BOJ was instructed to intervene last week remains unanswered, despite the violence of the bearish unwind, USD/JPY continues to be respectful of known technical levels, providing something akin to a blueprint for traders to focus on.
The immediate range in focus is 156.68 on the topside and 155.50 on the downside, with the former coinciding with the low set on August 7, while the latter is the top of a zone that has sparked some savage bounces over the course of this year.
While the overall message from the oscillators continues to favour selling into strength and downside breaks, with RSI (14) still sitting at 34 and MACD remaining beneath the signal line in negative territory, the rapid increase in downside momentum looks to have reversed slightly thanks to the strong payrolls print last Friday.
My view is therefore to place greater emphasis on price action rather than holding a specific directional bias in the near term. While we entered this range at rapid velocity from above, you can’t dismiss the fact we’ve seen some big bounces from this zone in the past.
On the topside, above 156.68, the levels to keep an eye on are 158, which has acted as both support and resistance for periods this year, and 159.50, another similar level above that.
Underneath, 155.50 down to 155 has been the support zone where bids have been lurking this year. A clean break beneath the lower rung of that zone could bring 154 into play, which has acted as both resistance and support for periods this year, along with 152.09, 151.50 and a more prominent support level at 151.
Latest market news




Open an account in minutes
Experience award-winning platforms with fast and secure execution, and enjoy tight spreads from 0.5 pts on FX and 0.3 pts on indices.
Economic calendar
Web Trader platform
Our sophisticated web-based platform is packed with features.
Related articles
Canadian Dollar Short-term Outlook: USD/CAD Five-Week Rally Hits a Wall at Major Resistance 10 14 2026
USD/CAD is holding near fresh yearly highs, but bearish divergence and a well-defined October range raise the stakes at major resistance.

EUR/USD Analysis: Euro Loses Ground After a Stronger-Than-Expected U.S. CPI Report
The trading week continues to unfold and weakness around the euro has once again become increasingly evident in the short term. This can be seen in the recent performance of EUR/USD, which has declined roughly 0.3% over the last three trading sessions, highlighting renewed strength in the U.S. dollar.

USD/JPY forecast: hot US CPI lifts the pair above its 200-day average
Hotter-than-expected US inflation has pushed USD/JPY above its 200-day moving average, putting 160 and the risk of Bank of Japan intervention back in focus. The breakout still needs to hold, and a failure could send the pair sharply lower.

This report is intended for general circulation only. It should not be construed as a recommendation, or an offer (or solicitation of an offer) to buy or sell any financial products. The information provided does not take into account your specific investment objectives, financial situation or particular needs. Before you act on any recommendation that may be contained in this report, independent advice ought to be sought from a financial adviser regarding the suitability of the investment product, taking into account your specific investment objectives, financial situation or particular needs.
StoneX Financial Pte. Ltd., may distribute reports produced by its respective foreign entities or affiliates within the StoneX group of companies or third parties pursuant to an arrangement under Regulation 32C of the Financial Advisers Regulations. Where the report is distributed to a person in Singapore who is not an accredited investor, expert investor or an institutional investor (as defined in the Securities Futures Act), StoneX Financial Pte. Ltd. accepts legal responsibility to such persons for the contents of the report only to the extent required by law. Singapore recipients should contact StoneX Financial Pte. Ltd. at 6826 9988 for matters arising from, or in connection with the report.
In the case of all other recipients of this report, to the extent permitted by applicable laws and regulations neither StoneX Financial Pte. Ltd. nor its associated companies will be responsible or liable for any loss or damage incurred arising out of, or in connection with, any use of the information contained in this report and all such liability is hereby expressly disclaimed. No representation or warranty is made, express or implied, that the content of this report is complete or accurate.
StoneX Financial Pte. Ltd. is not under any obligation to update this report.
Trading CFDs carries a high level of risk that may not be suitable for some investors. Consider your investment objectives, level of experience, financial resources, risk appetite and other relevant circumstances carefully. The possibility exists that you could lose some or all of your investments, including your initial deposits. If in doubt, please seek independent expert advice. Visit www.forex.com/en-sg/terms-and-policies for the complete Risk Disclosure Statement.