


USD/JPY Weekly Outlook: Oil shock offsets mounting AI concerns
USD/JPY has barely moved despite tumbling US Treasury yields and a sharp selloff in AI stocks. Can elevated energy prices continue to offset the pressure?
Share this:

- USD/JPY defies sharp declines in US yields
- AI earnings threaten further tech-driven volatility
- US activity data takes priority over inflation
- Yen positioning limits potential carry-unwind risks
- USD/JPY downside risks build
It's another stacked week when it comes to known risk events, although, as was the case in the final week of October, USD/JPY direction could well come down to how sentiment towards the AI buildout evolves.
Markets are treating it as something of a proxy for the longer-term US nominal growth outlook, helping to explain the powerful bid seen in US Treasuries last week and resulting sharp decline in yields.
Under normal circumstances, that would be expected to weigh on the pair, yet downside has proved fleeting so far, perhaps explained by elevated energy prices as speculation continues to mount about a potential resumption of US air strikes on Iran after the US midterm elections.
USD/JPY shrugs off Treasury rally
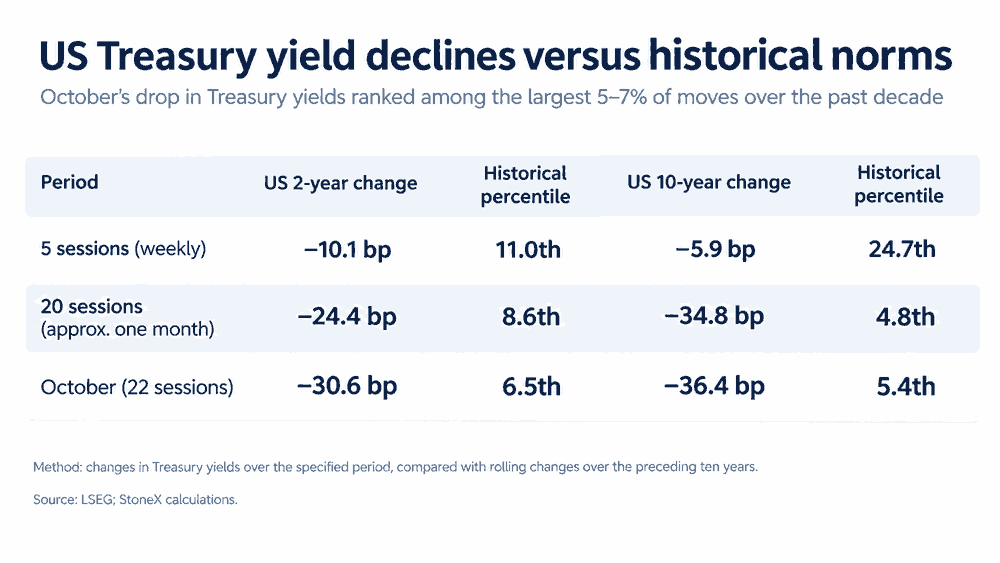
After a significant sell-off in the September quarter, October brought a sizeable rally in US Treasuries with two-year yields tumbling 30.6 basis points and benchmark ten-year yields shedding 36.4 basis points. As seen in the graphic below, both rank among the largest 5–7% of comparable moves over the past decade, underlining just how rapid the reversal has been.
Source: LSEG
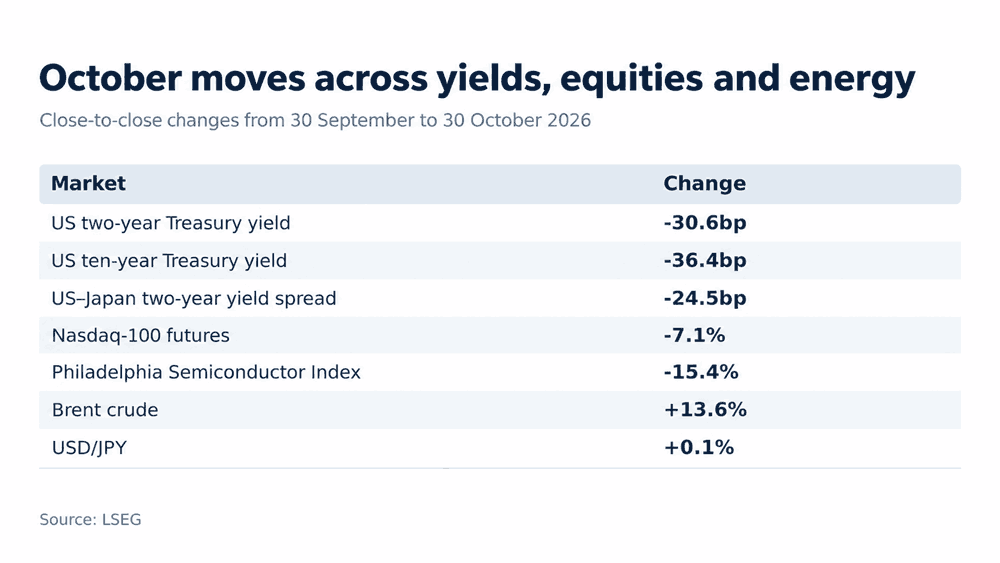
As has been well documented, the move coincided with a sharp sell-off in AI-linked tech stocks, with Nasdaq-100 futures sliding 7.1% and the SOX index plunging 15.4%.
Despite the compression in yield differentials between the United States and Japan, USD/JPY finished October almost exactly where it started, actually rising 0.1%. My sense is that elevated energy prices, which are hammering Japan's terms of trade, may be acting as a counterweight at this point, meaning fluctuations in Brent crude and other key energy markets should be monitored by traders in the week ahead.
Source: LSEG
AI sentiment remains a major influence on USD/JPY
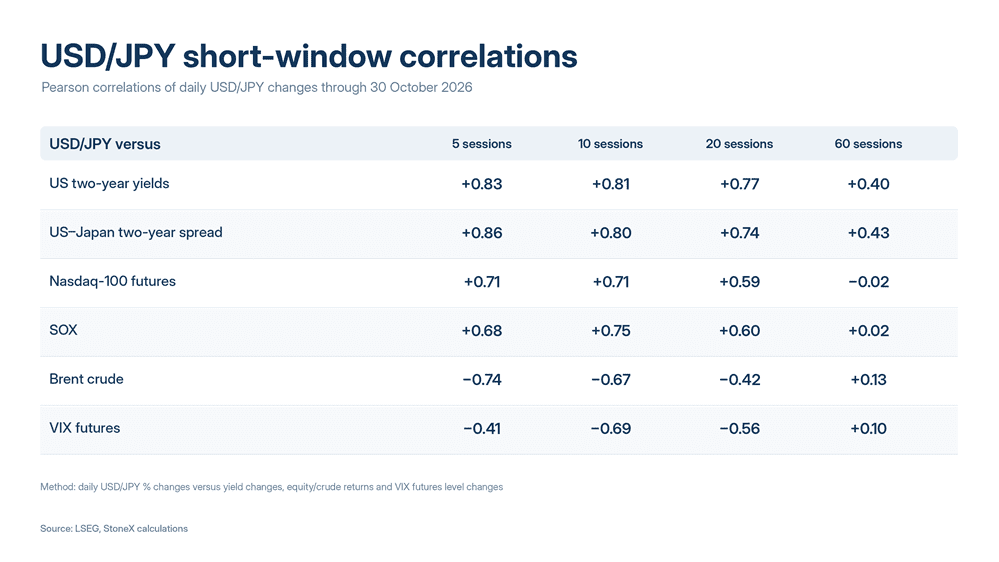
It may not be exerting significant force when it comes to the scale of directional moves, but one look at the correlation matrix below shows that USD/JPY continues to maintain a strong short-term relationship with US Treasury yields and tech stocks. Over the past ten sessions, daily changes in the pair have recorded correlations of +0.81 with US two-year yields, +0.71 with Nasdaq-100 futures and +0.75 with the SOX index.
Source: LSEG
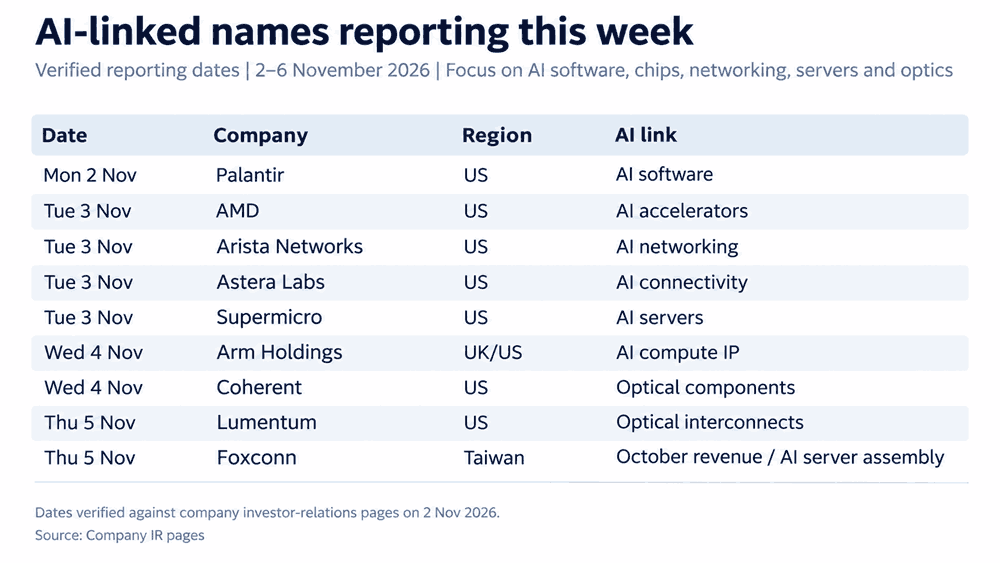
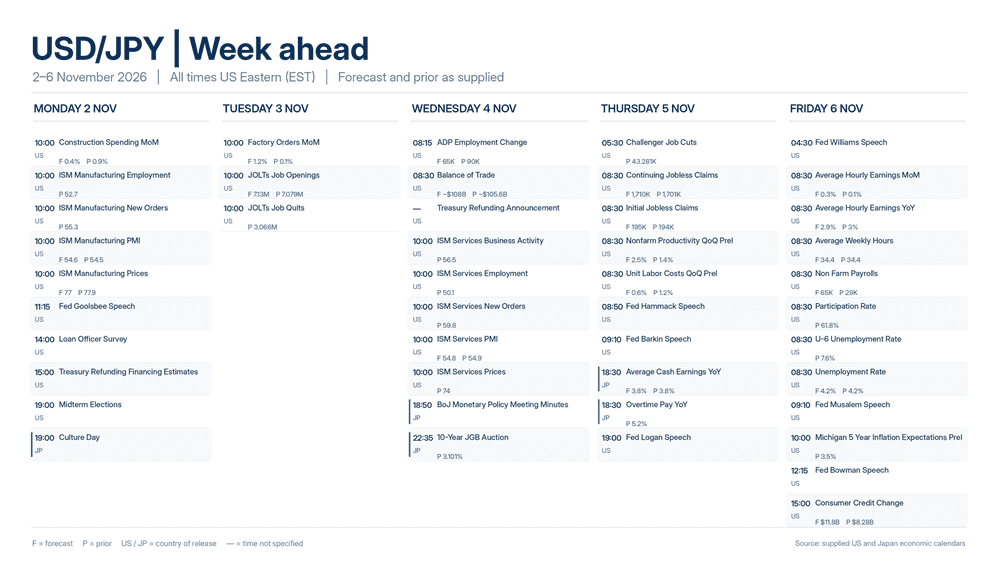
As the below graphic shows, along with upcoming economic data that we'll touch upon in a moment, that puts AI-linked earnings reports out this week clearly in the crosshairs, with AMD, Arista Networks, Astera Labs, Supermicro and Arm among the big names to report. Guidance is arguably even more important than the actual figures, which traders have tended to look through in recent times.
Source: TradingView
Given the correlation between USD/JPY and tech stocks, an extension of last week's slump in the AI complex could add further downside pressure on the pair, particularly if accompanied by softer US economic data and lower energy prices.
US activity data takes centre stage
Market sensitivity has shifted towards the US growth outlook rather than inflation recently, putting this week's activity and labour market indicators in focus. That includes the ISM manufacturing and services surveys, along with Friday's nonfarm payrolls report, which could carry more weight than usual given the weakness in tech stocks.
Source: TradingView
The ISM surveys may offer the most useful information given they provide a timely snapshot of economic conditions. While we've yet to see convincing evidence of the growth slowdown that markets are jumping at shadows about, any signs of weakness, particularly in the new orders subindex, could have an outsized influence on Treasury yields.
We'll get an updated snapshot of US Treasury's borrowing requirements on Monday, but Wednesday's Quarterly Refunding Announcement (QRA) will be far more important. The focus will be on auction sizes, given speculation that Treasury may reduce longer-dated issuance to help cap yields that influence the US mortgage market, along with updated guidance on buybacks after maximum operation sizes in the ten-to thirty-year sectors were doubled in August. Those arrangements expire at this week's QRA.
As for Tuesday's US midterm elections, barring a Democratic clean sweep of Congress or an unusually strong Republican showing relative to current polling, it's difficult to see the outcome having a lasting influence on USD/JPY. The Japanese calendar is also secondary, despite key wages data due later in the week. Last Friday we had the BOJ interest rate decision and Tokyo CPI release, yet you wouldn't even know they occurred looking at the price action.
Yen carry unwind risks remain
With a sharp compression in yield spreads, increased volatility, losses in tech stocks and a gradual increase in short-term Japanese borrowing costs, conditions that could spark forced carry-trade unwinds have been evident for some time now. Yet there's little evidence as yet that we'll see a repeat of the last major episode in mid-2024.
Source: LSEG
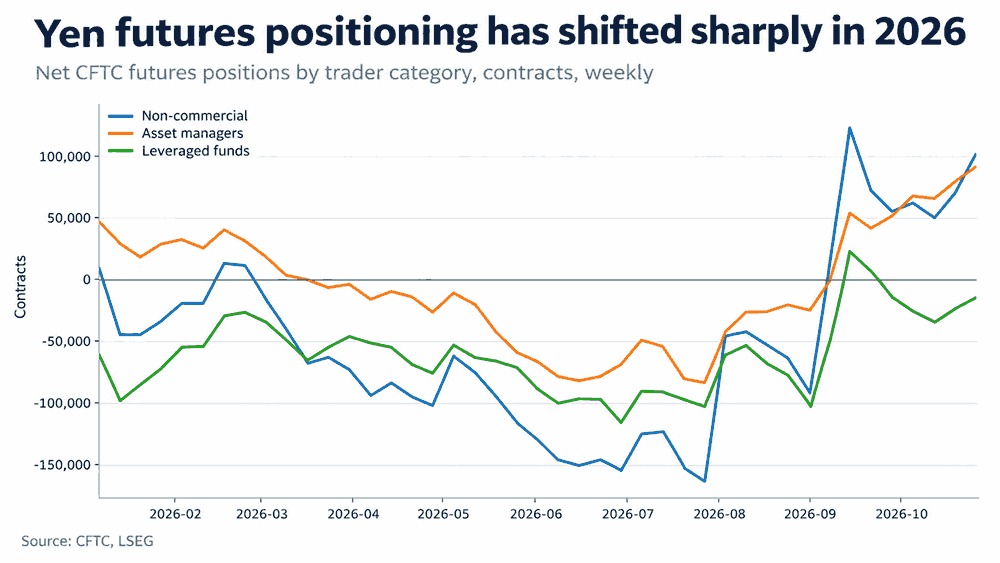
The latest snapshot of CFTC positioning data above may partially explain why. As of the close of business last Tuesday, non-commercial speculators were net long 101,591 yen futures contracts, while asset managers held net longs of 91,191. Leveraged funds, meanwhile, were net short just 14,630 contracts.
While futures positioning doesn't capture the entire market, the absence of substantial speculative yen shorts suggests the risk of a disorderly carry-trade unwind may be somewhat reduced, at least compared with previous episodes.
USD/JPY downside risks building
Source: Tradingview
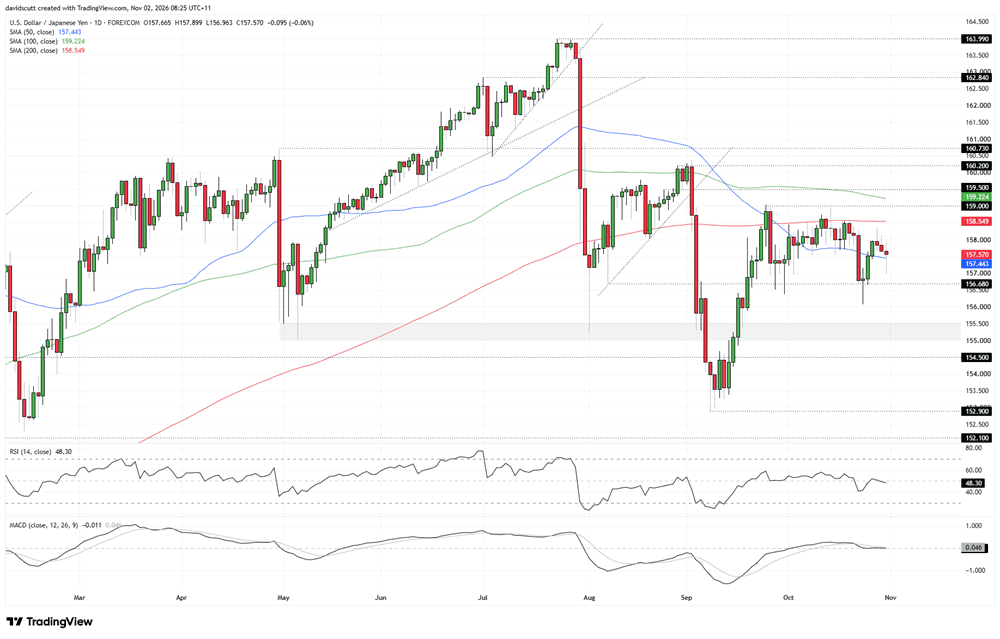
While USD/JPY managed to reclaim the dynamic range between the 50 and 200-day moving averages early last week, what we've seen over recent days is the lower end of that range being tested repeatedly, with an attempt to break below the 50-day moving average on Friday eventually faltering.
Even so, the pair looks heavy at this point, suggesting we could revisit support at 156.68, where buyers have emerged on multiple occasions this year, including on October 23. Below that, 156.08, the low set on October 23, is the next level of note, followed by the more pronounced support zone running from 155.50 down to 155.00, which sparked significant bounces following intervention episodes earlier this year.
Should that zone give way, 154.50 and 152.90, the latter being the low set in early September, are the next downside levels to watch.
If USD/JPY continues to oscillate within the dynamic range between the 50 and 200-day moving averages, the latter, shown in red, is naturally the first level to watch overhead, followed by 159.00, the 100-day moving average in green around 159.20 and 159.50.
Even though the oscillators are neutral in their messaging, it does feel like directional risks beyond the ultra-short term are skewing to the downside.
Latest market news




Open an account in minutes
Experience award-winning platforms with fast and secure execution, and enjoy tight spreads from 0.5 pts on FX and 0.3 pts on indices.
Economic calendar
Web Trader platform
Our sophisticated web-based platform is packed with features.
Related articles
Nasdaq 100 warning signs mount after brutal October
The Nasdaq 100 has printed a bearish monthly key reversal after a brutal October, with weak market breadth and heavy losses among AI beneficiaries raising the risk of further downside.
Yen Bulls Loaded Up into BOJ as Euro Shorts Hit 11-Year Extreme| COT report
Yen bulls piled into futures ahead of the BOJ's hawkish hold, while euro shorts reached an 11-year extreme despite EUR/USD holding above support.

Crude Oil Weekly Outlook: U.S.–Iran Deal Hopes Ahead of Elections?
Crude oil weekly outlook: U.S.–Iran negotiations may be moving closer to a breakthrough as the U.S. midterm elections approach on Tuesday, bringing key resistance levels on crude oil charts into focus.

This report is intended for general circulation only. It should not be construed as a recommendation, or an offer (or solicitation of an offer) to buy or sell any financial products. The information provided does not take into account your specific investment objectives, financial situation or particular needs. Before you act on any recommendation that may be contained in this report, independent advice ought to be sought from a financial adviser regarding the suitability of the investment product, taking into account your specific investment objectives, financial situation or particular needs.
StoneX Financial Pte. Ltd., may distribute reports produced by its respective foreign entities or affiliates within the StoneX group of companies or third parties pursuant to an arrangement under Regulation 32C of the Financial Advisers Regulations. Where the report is distributed to a person in Singapore who is not an accredited investor, expert investor or an institutional investor (as defined in the Securities Futures Act), StoneX Financial Pte. Ltd. accepts legal responsibility to such persons for the contents of the report only to the extent required by law. Singapore recipients should contact StoneX Financial Pte. Ltd. at 6826 9988 for matters arising from, or in connection with the report.
In the case of all other recipients of this report, to the extent permitted by applicable laws and regulations neither StoneX Financial Pte. Ltd. nor its associated companies will be responsible or liable for any loss or damage incurred arising out of, or in connection with, any use of the information contained in this report and all such liability is hereby expressly disclaimed. No representation or warranty is made, express or implied, that the content of this report is complete or accurate.
StoneX Financial Pte. Ltd. is not under any obligation to update this report.
Trading CFDs carries a high level of risk that may not be suitable for some investors. Consider your investment objectives, level of experience, financial resources, risk appetite and other relevant circumstances carefully. The possibility exists that you could lose some or all of your investments, including your initial deposits. If in doubt, please seek independent expert advice. Visit www.forex.com/en-sg/terms-and-policies for the complete Risk Disclosure Statement.