



USD Price Action Setups: EUR/USD, GBP/USD, USD/JPY, USD/CAD, EUR/JPY, EUR/GBP
It was a big week for markets and hope rules the day as the ceasefire announcement created a gap-down in the USD that still hasn’t been recovered.
Share this:

Given the response in equity markets it can seem simple to assume that the worst is behind us with the conflict in Iran. But most news reports indicate that the ceasefire is far from a done deal and with negotiations set to take place over the weekend, I think it behooves traders to keep an open mind for how these scenarios can play out.
In currencies, the response has been similarly clear with the USD gapping-down on the back of the ceasefire announcement and holding lower through the end of the week. There’s some unfilled gap from that announcement, and that remains a spot of lower-high resistance potential. But the fact that even that could not fill and sellers remained heavy on the offer highlights just how much confidence there is that we may be closer to the end of the saga than the beginning.
That said, the response in USD/JPY has been more tepid, as the initial pullback on Wednesday has been followed so far by two days of strength. And if we do see a material worsening in the conflict, if the negotiations this weekend are not successful, that could bring on a scenario that spells significant strength for the USD.
In the DXY basket, the notable item from last week was both the increase in expectations for a rate cut from the Fed, combined with the fact that buyers couldn’t even pose a gap-fill from the Wednesday sell-off. That gap now remains as lower-high resistance potential into next week, and deeper support in DXY rests around the resistance from the ascending triangle that led to breakout in March, plotted around the Fibonacci level of 97.94.
US Dollar Daily Chart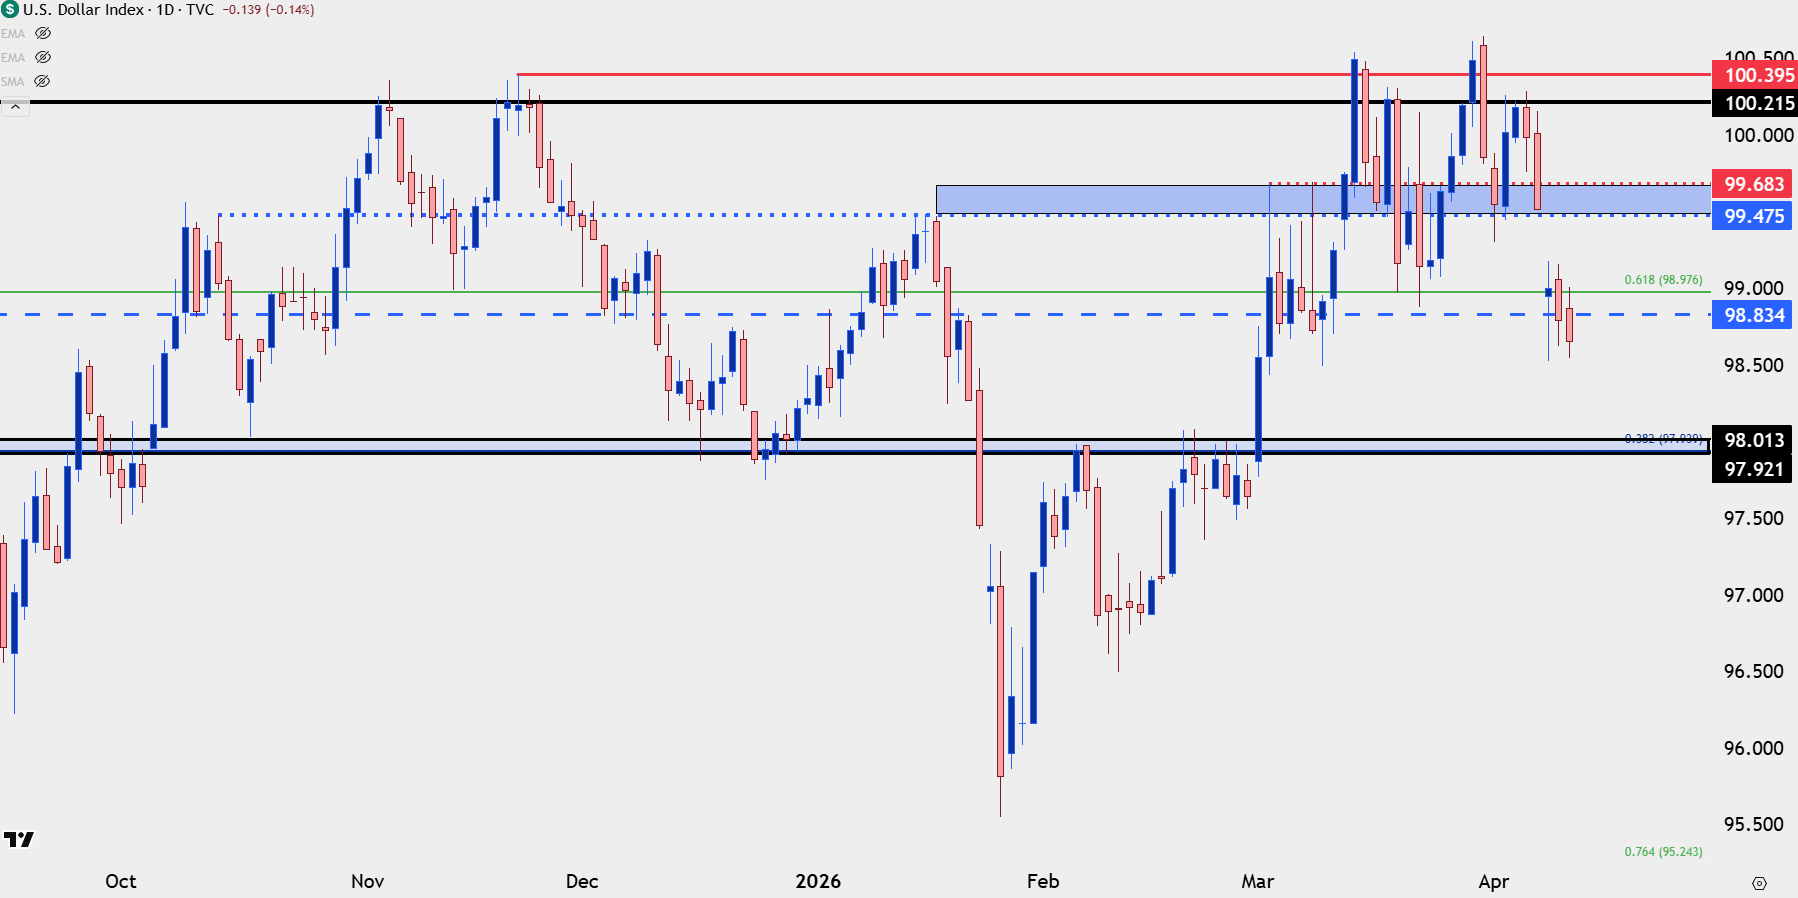
Chart prepared by James Stanley; data derived from Tradingview
EUR/USD
EUR/USD came into the week with higher-lows as looked at in the Monday video, and that higher-low structuring led to a strong breakout on Wednesday with the ceasefire announcement. As we wind into the end of the week EUR/USD has even pushed up towards the next zone of resistance in the 1.1742-1.1766 area, and that was followed by a pullback and show of higher-low support at prior resistance of 1.1655.
EUR/USD Four-Hour Chart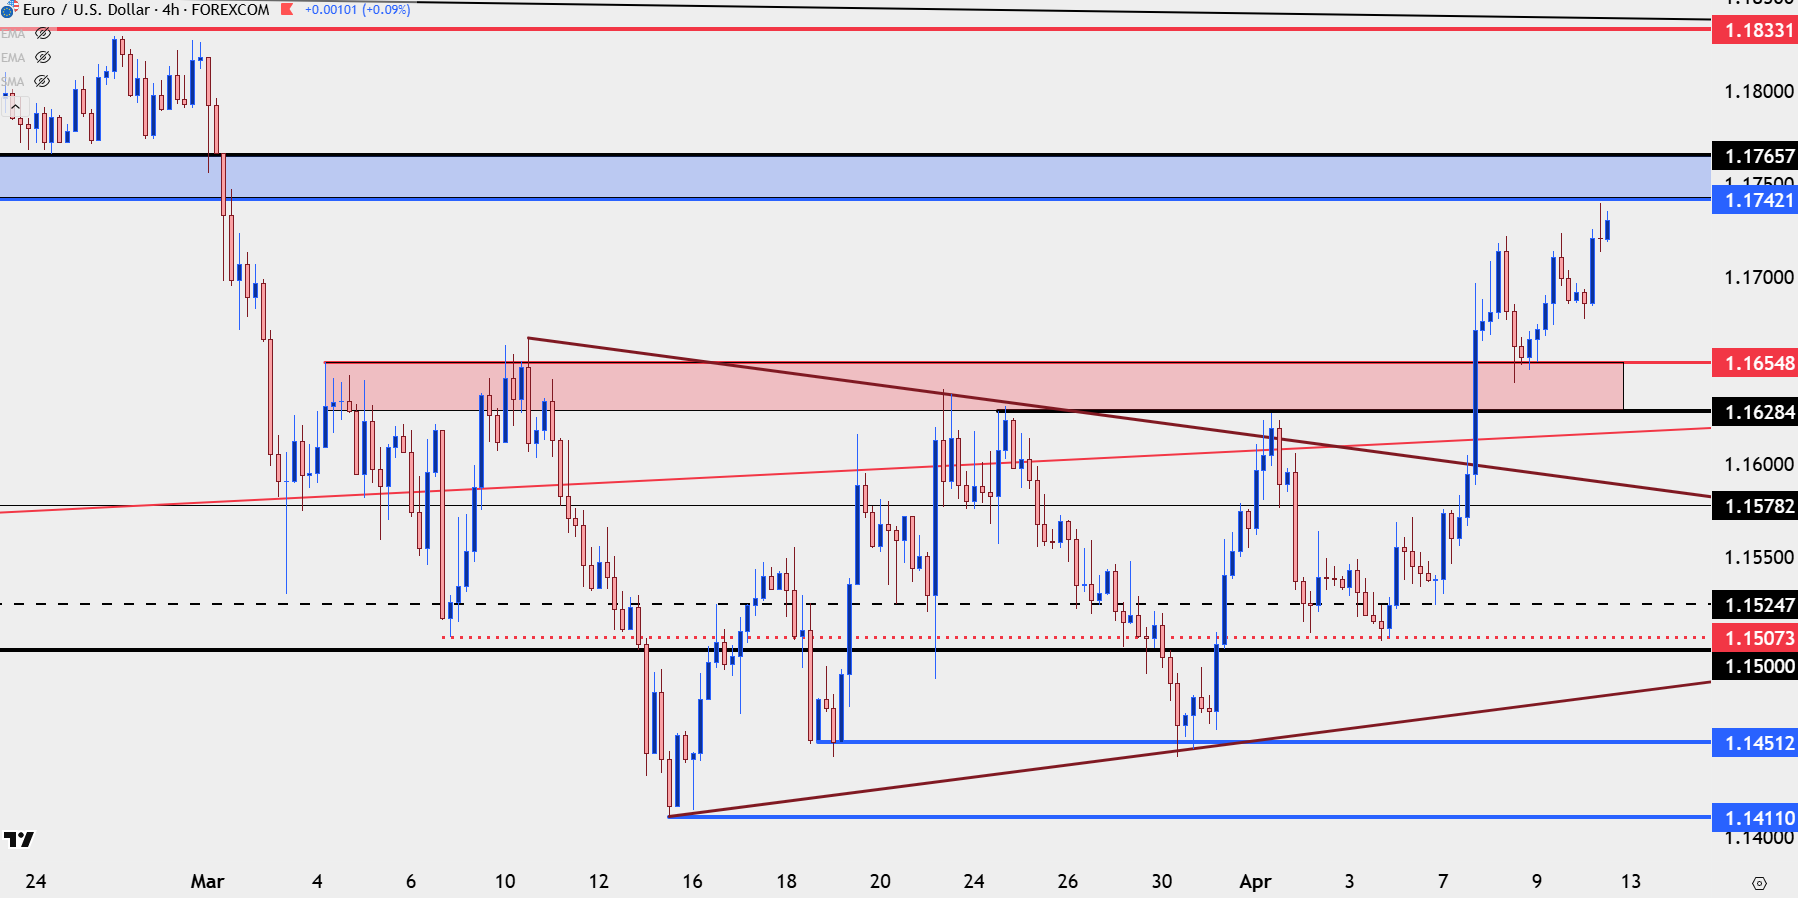
Chart prepared by James Stanley; data derived from Tradingview
GBP/USD
Coming into the week, GBP/USD didn’t look as strong as EUR/USD and the horizontal support from last week after a fresh lower-low illustrates that, because EUR/USD had higher-low structure to work with.
It was the EUR/GBP pound that highlighted the possibility of change on the horizon and as we wind into the end of the week, GBP/USD is actually up a touch more than EUR/USD as Cable broke out of a falling wedge formation and continued to rally.
At this point, GBP/USD is up about 2.1% for the week while EUR/USD is up around 1.9%, so it’s been approximately 10% additional strength in GBP/USD and this is something worth watching for next week as it can remain relevant to both USD pairings and JPY pairs, which I’ll look at a little later.
GBP/USD Daily Price Chart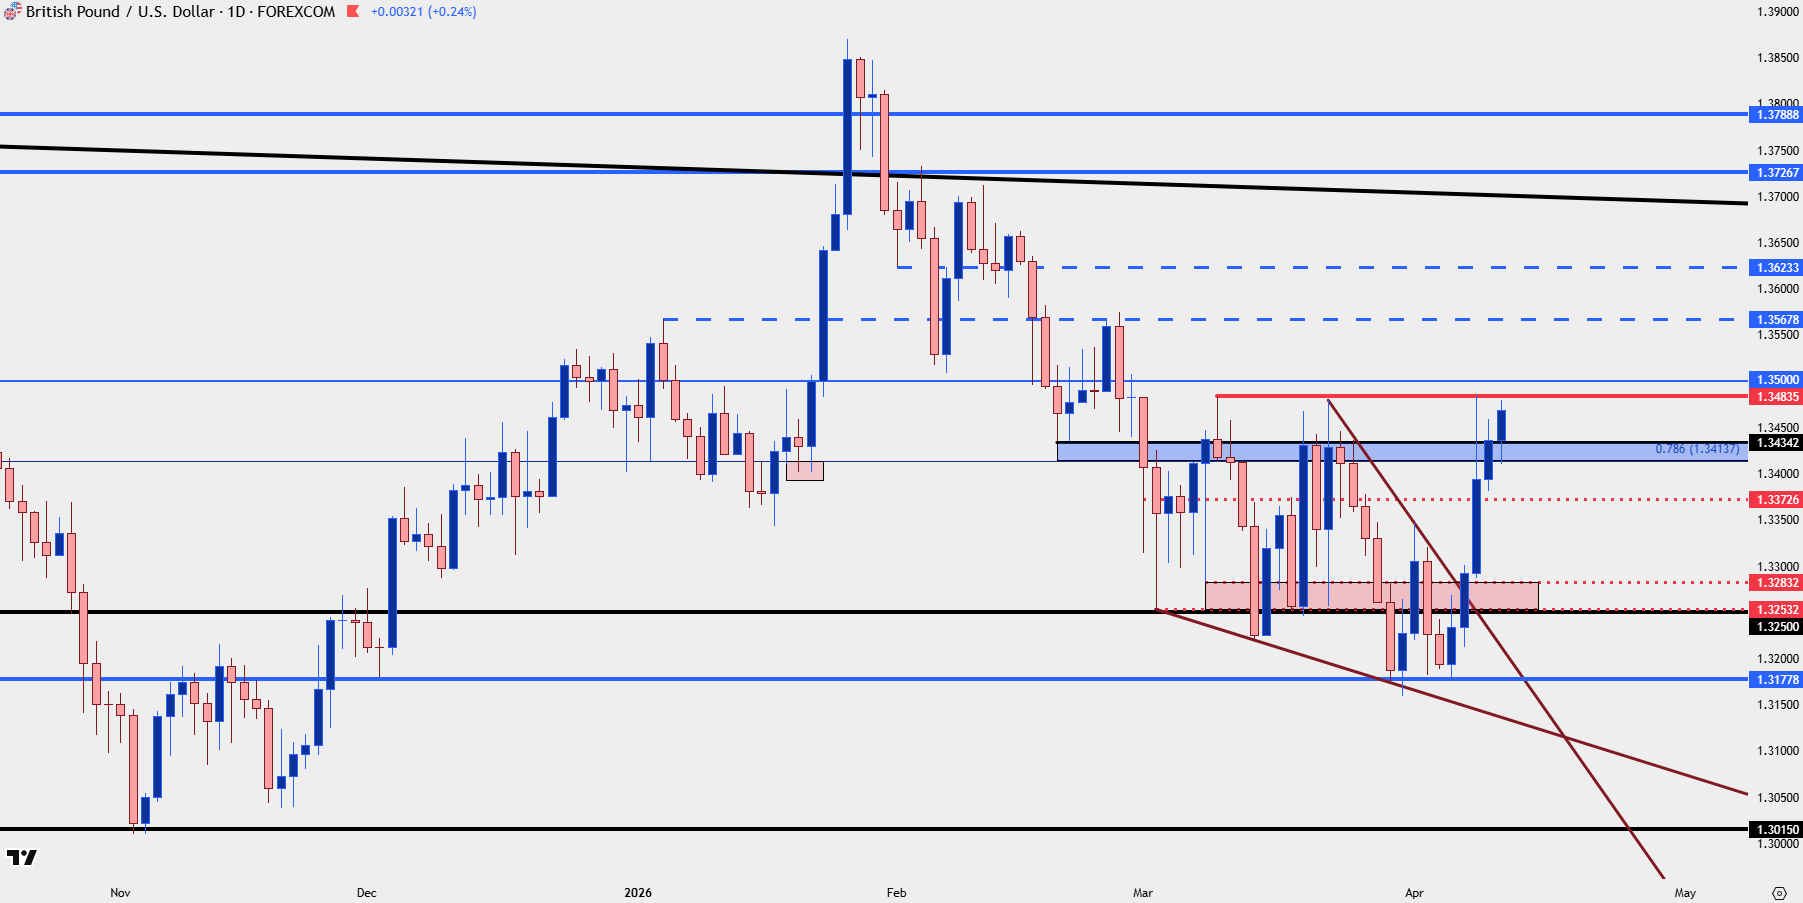
Chart prepared by James Stanley; data derived from Tradingview
EUR/GBP
A cross-pair like EUR/GBP can often be considered as a market more prone towards mean reversion versus trends or breakouts, and the fact that much of the past decade has been spent within a 1,000 pip range illustrates that.
But – the dynamics of the cross can play out in a few ways, including against the representative major pairs as looked at above between GBP/USD and EUR/USD.
In EUR/GBP, the pair came into the week holding a big spot of resistance. That greater Euro strength shows why EUR/USD was building higher-lows while GBP/USD was holding that support line-in-the-sand. There’s more potential for this pair to pullback as we go into next week and that can be relevant in both USD and JPY markets, as well.
EUR/GBP Daily Price Chart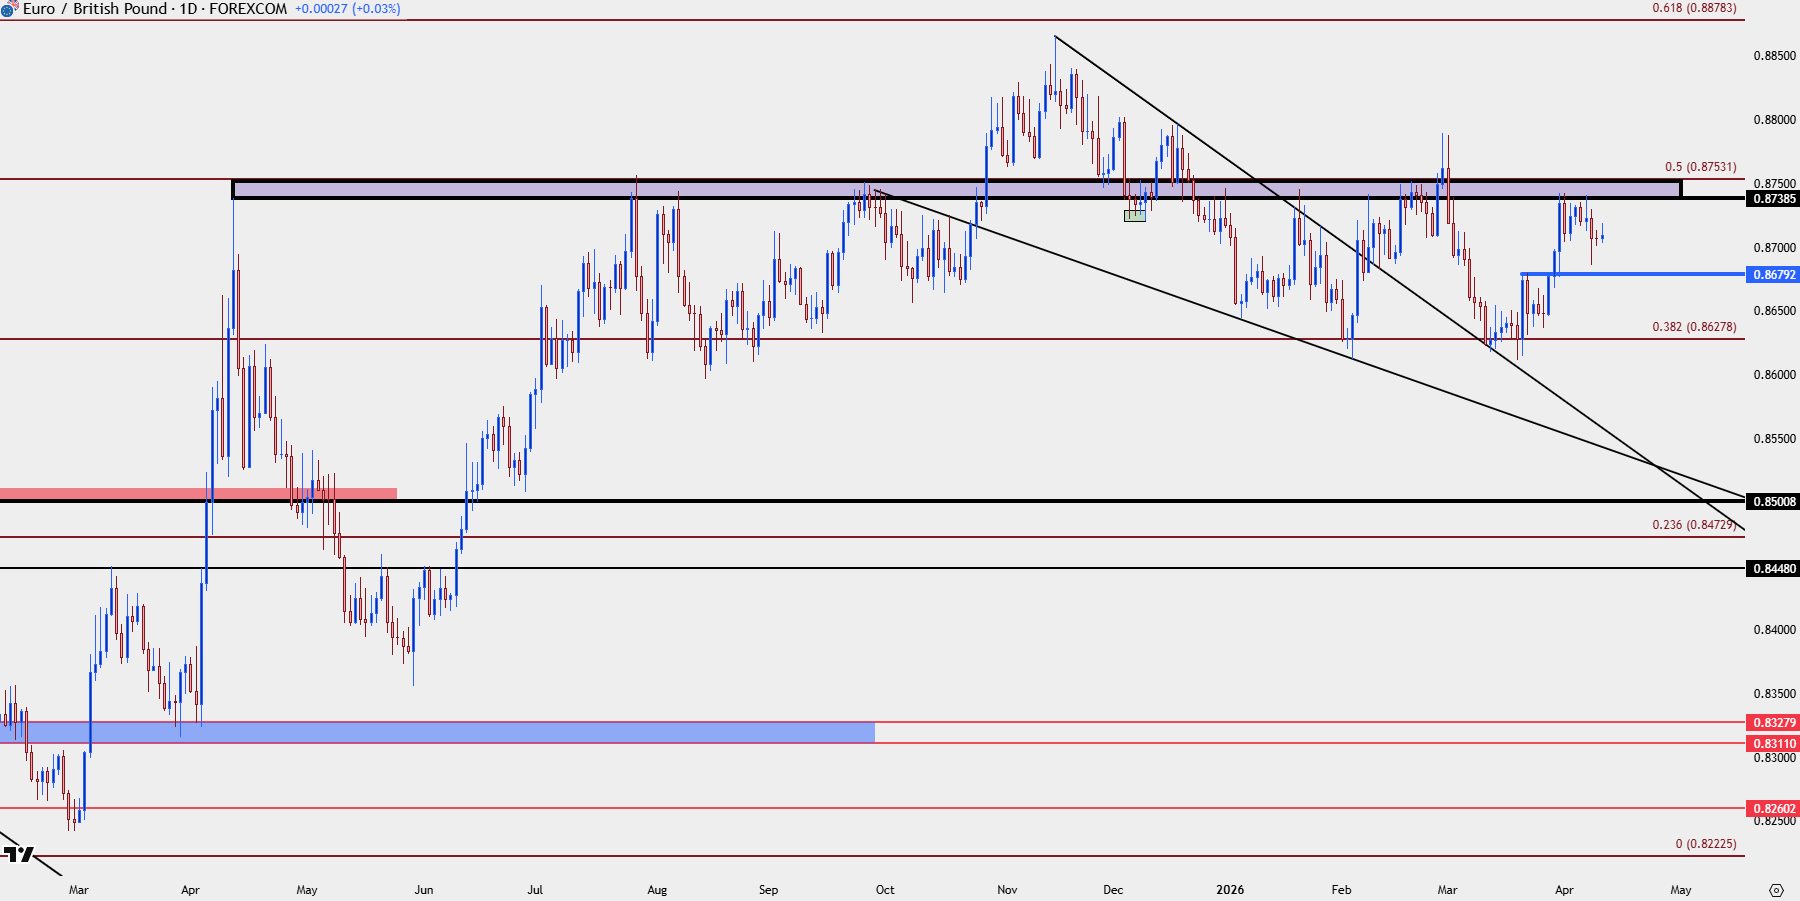
Chart prepared by James Stanley; data derived from Tradingview
USD/JPY
While USD-weakness was on full display after the ceasefire announcement, it was more questionable against the Japanese Yen which gained on both Thursday and Friday.
The pullback on Wednesday was clean, with price pushing down to support at prior resistance around the 158.00 handle. As we go into next week, this would be one of the outliers that could be attractive for long-USD setups but this would likely need to see some additional tension in the Middle East, driving higher inflation expectations and pricing out rate cut potential in the US for later in the year. In that scenario, the BoJ may not find defending the 160.00 level so simple, and, instead, may case that line in the sand for JPY defense up to a 161.95 or 165.00 level.
USD/JPY Daily Price Chart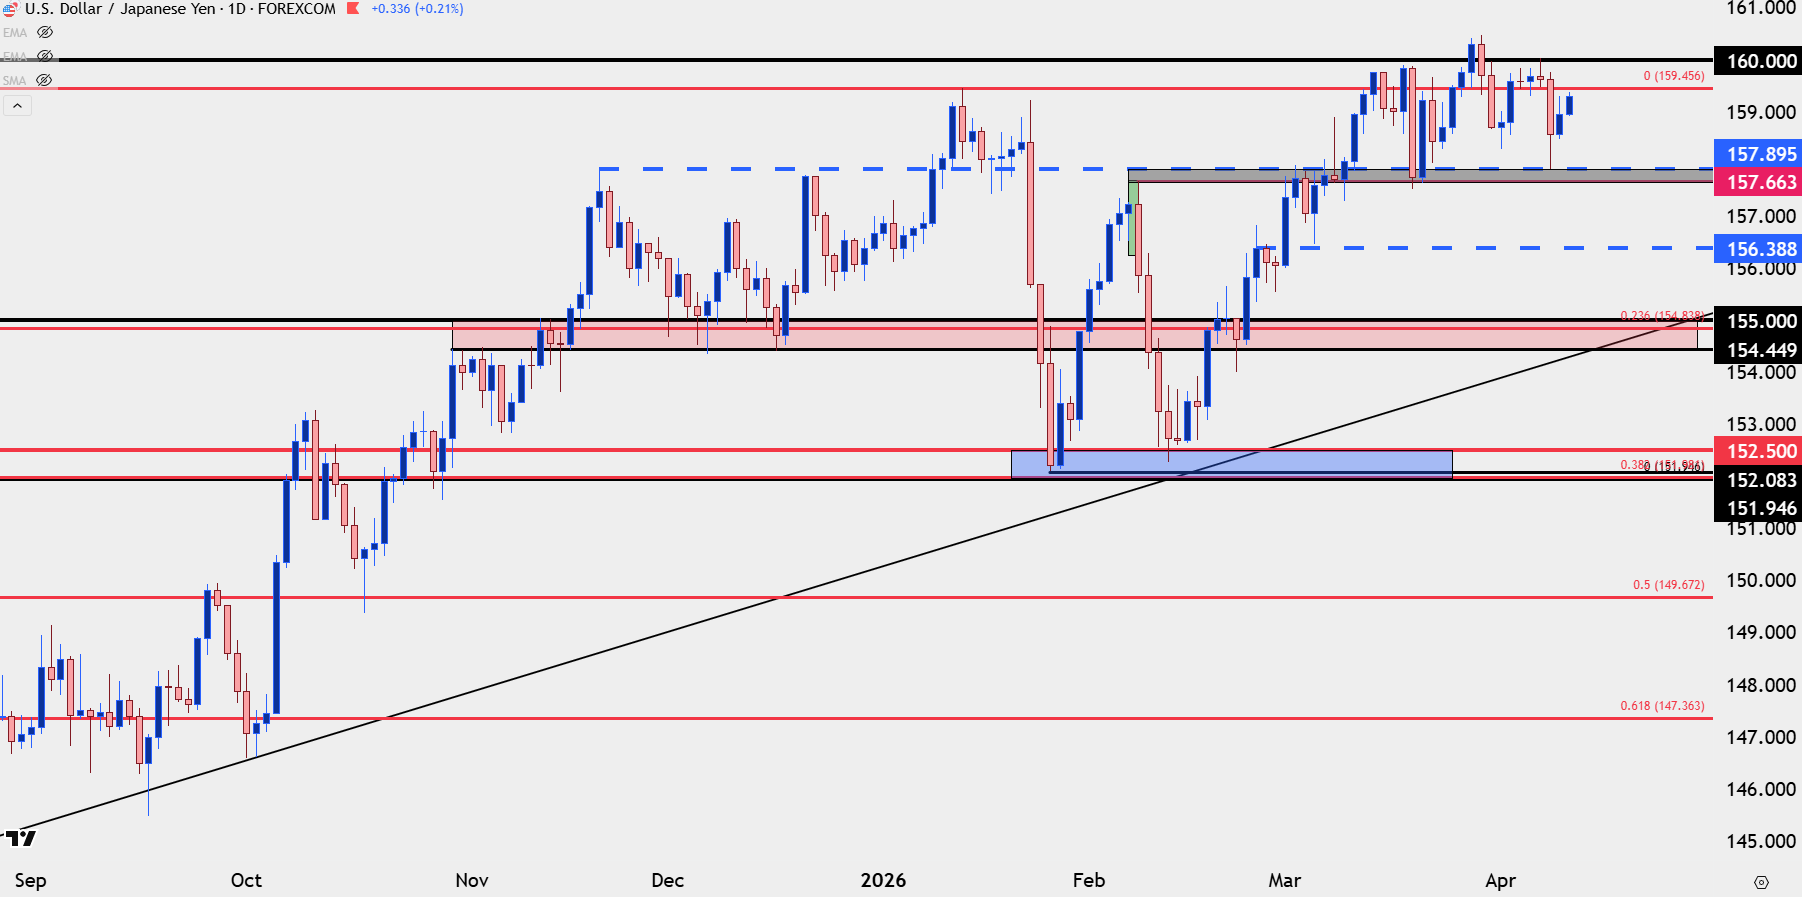
Chart prepared by James Stanley; data derived from Tradingview
EUR/JPY
While USD/JPY was grinding and the weekly chart illustrates that well, EUR/JPY was flying.
The pair built a bull pennant formation coming into this week and I had looked at that in the Monday video as resistance was starting to give way. Bulls pushed aggressively through the rest of the week and as we go into the final few hours of trade the pair has continued to push towards a fresh ATH.
EUR/JPY Daily Chart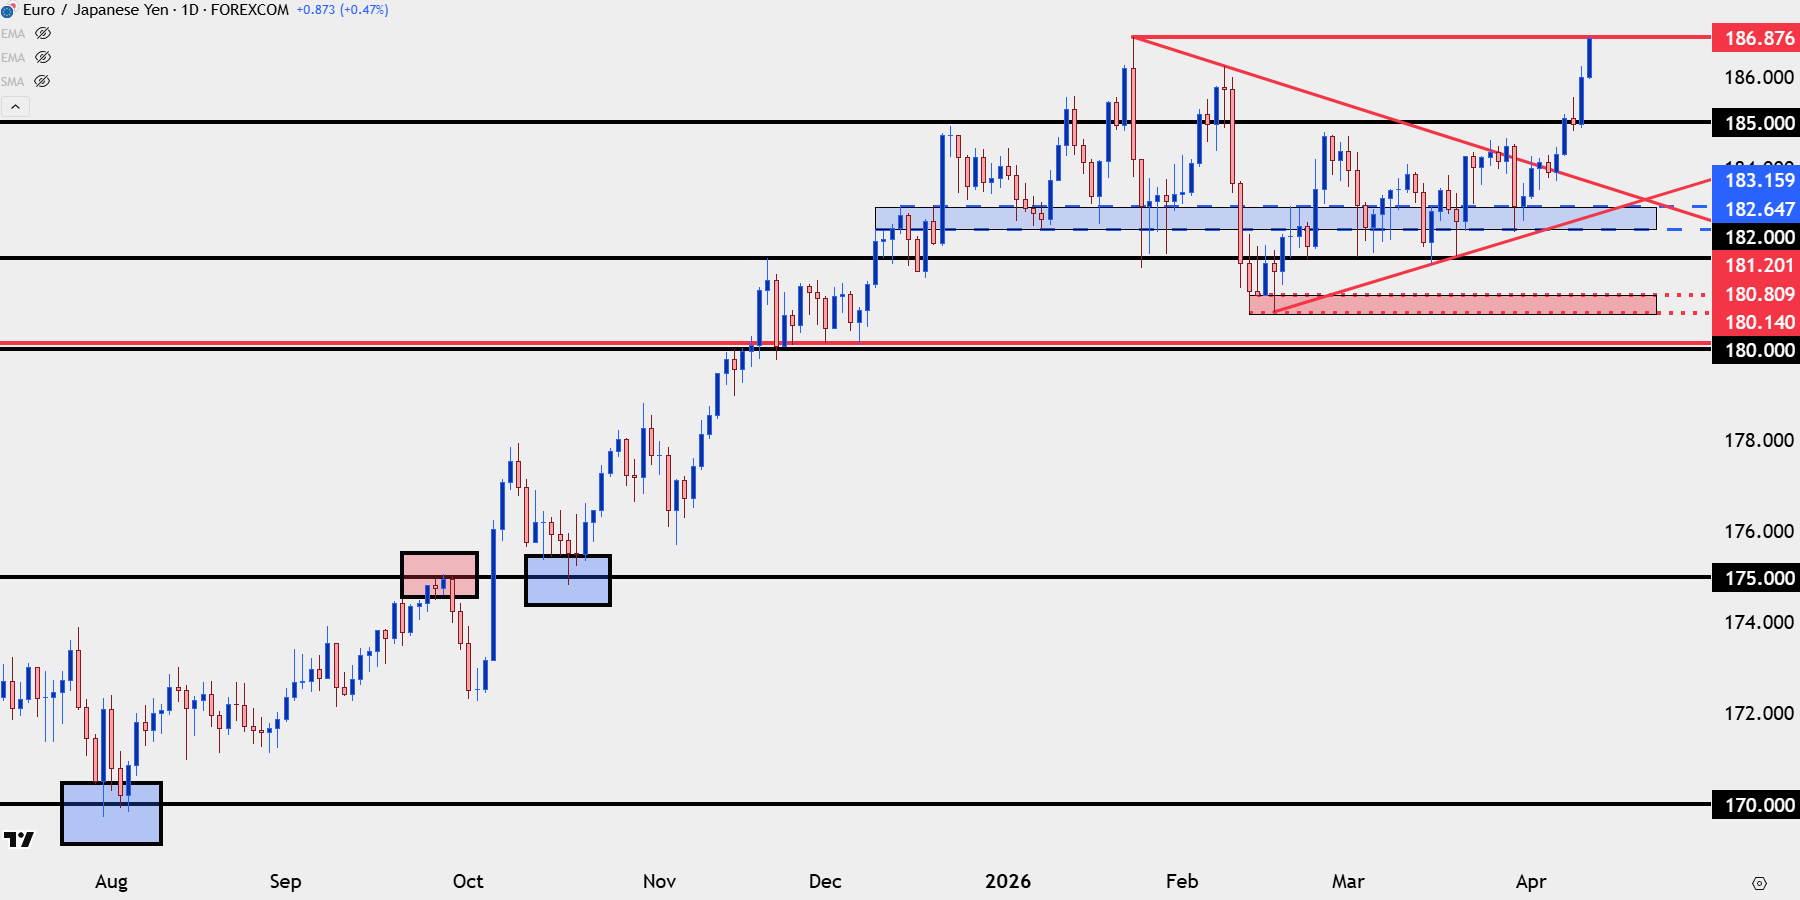
Chart prepared by James Stanley; data derived from Tradingview
GBP/JPY
Speaking to that greater sterling strength, GBP/JPY is currently up 1.87% on the week versus 1.6% for EUR/JPY. GBP/JPY has also gained for each of the past five days following a support test at the 210 zone last week, and as we go into next week, prior resistance of 213.31 or 211.68-212.03 stand out for higher-low support potential.
GBP/JPY Daily Price Chart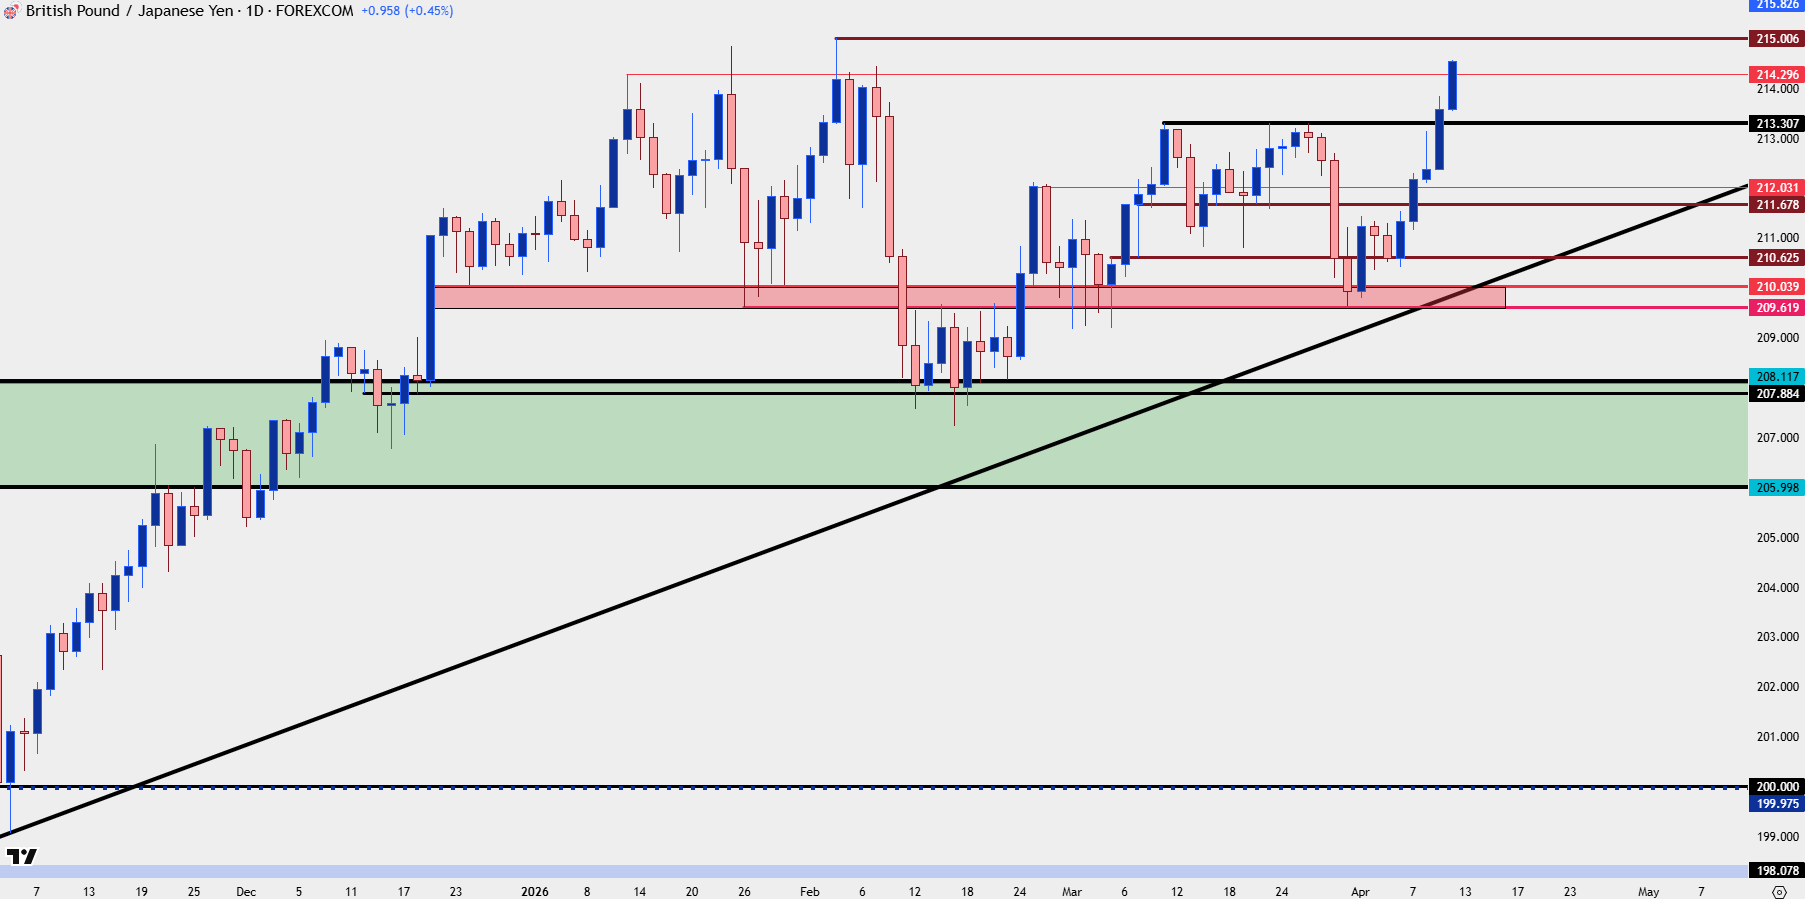
Chart prepared by James Stanley; data derived from Tradingview
--- written by James Stanley, Senior Market Analyst, Global Macro


Open an account in minutes
Experience award-winning platforms with fast and secure execution, and enjoy tight spreads from 0.5 pts on FX and 0.3 pts on indices.
Economic calendar
Web Trader platform
Our sophisticated web-based platform is packed with features.
Related articles
What Stretched 10-Year Yields Mean for Major Currency Pairs in Q4
U.S. 10-year Treasury yields are nearing a long-term resistance zone with overbought RSI readings, raising near-term pullback risk for the dollar.

USD/CAD shooting star puts September surge on notice
USD/CAD has printed a clear bearish reversal pattern after an extraordinary September surge, but confirmation may depend heavily on how US Treasury yields react to Friday’s payrolls report.


Canadian Dollar Analysis: USD/CAD Returns to July Highs Ahead of NFP
The Canadian dollar continues to face one of its most challenging environments in recent months when it comes to maintaining strength against the U.S. dollar. The weakness of the Canadian currency is clearly reflected in USD/CAD, which has now recorded nine consecutive bullish sessions and gained more than 1.7% during that period.

This report is intended for general circulation only. It should not be construed as a recommendation, or an offer (or solicitation of an offer) to buy or sell any financial products. The information provided does not take into account your specific investment objectives, financial situation or particular needs. Before you act on any recommendation that may be contained in this report, independent advice ought to be sought from a financial adviser regarding the suitability of the investment product, taking into account your specific investment objectives, financial situation or particular needs.
StoneX Financial Pte. Ltd., may distribute reports produced by its respective foreign entities or affiliates within the StoneX group of companies or third parties pursuant to an arrangement under Regulation 32C of the Financial Advisers Regulations. Where the report is distributed to a person in Singapore who is not an accredited investor, expert investor or an institutional investor (as defined in the Securities Futures Act), StoneX Financial Pte. Ltd. accepts legal responsibility to such persons for the contents of the report only to the extent required by law. Singapore recipients should contact StoneX Financial Pte. Ltd. at 6826 9988 for matters arising from, or in connection with the report.
In the case of all other recipients of this report, to the extent permitted by applicable laws and regulations neither StoneX Financial Pte. Ltd. nor its associated companies will be responsible or liable for any loss or damage incurred arising out of, or in connection with, any use of the information contained in this report and all such liability is hereby expressly disclaimed. No representation or warranty is made, express or implied, that the content of this report is complete or accurate.
StoneX Financial Pte. Ltd. is not under any obligation to update this report.
Trading CFDs carries a high level of risk that may not be suitable for some investors. Consider your investment objectives, level of experience, financial resources, risk appetite and other relevant circumstances carefully. The possibility exists that you could lose some or all of your investments, including your initial deposits. If in doubt, please seek independent expert advice. Visit www.forex.com/en-sg/terms-and-policies for the complete Risk Disclosure Statement.