



USD/TRY explodes through 10. Will it reach 11?
Could this move above 10 just be a “buy the rumor, sell the fact” heading into the central bank meeting?
Share this:

USD/TRY busted through 10.00 on Monday, to close at 10.0617. On Tuesday, the pair moved aggressively higher reaching 10.4386, a daily range high of near 3.8%. The pair has been on a one-way street higher since September 7th when the USD/TRY was at 8.2718. Since then, the pair is up over 26%! What began initially as higher inflation worldwide, has turned into a one-man spectacle for President Erdogan. He has stated that he does not want the Central Bank of Turkey to raise rates, despite latest inflation readings of 19.89% YoY as of the October reading. The highest increases were in food prices. President Erdogan went as far as to fire those who were against cutting rates and replace them with those who will. Thus, at the last Central Bank of Turkey meeting, central bank officials cut rates by 200bps from 18% to 16%, well above the 50bps cut that was expected. Combine Turkey’s high inflation and rate cuts, with the US inflation (rising but much lower at 6.2%) and a US central bank in tapering/”soon to be hiking” mode, and USD/TRY is reaching new highs daily.
The Central Bank of Turkey meets again on Thursday. Expectations are for another 100bps rate cut, putting rates down to 15%. The next inflation reading isn’t until December 3rd. However, at their last meeting, the Committee noted that “till the end of the year, supply-side transitory factors leave limited room for the downward adjustment to the policy rate.” Therefore, is there a chance the committee could underwhelm the markets and cut less than 100bps? In addition, since the October 21st meeting, the Turkish Lira is down nearly 12% vs the US Dollar. It is possible that Tuesday’s aggressive move could just be a stop-run above 10.000, which will result in a “Buy the rumor, sell the fact” for USD/TRY after the meeting on Thursday.
Trade USD/TRY now: Login or open a new account!
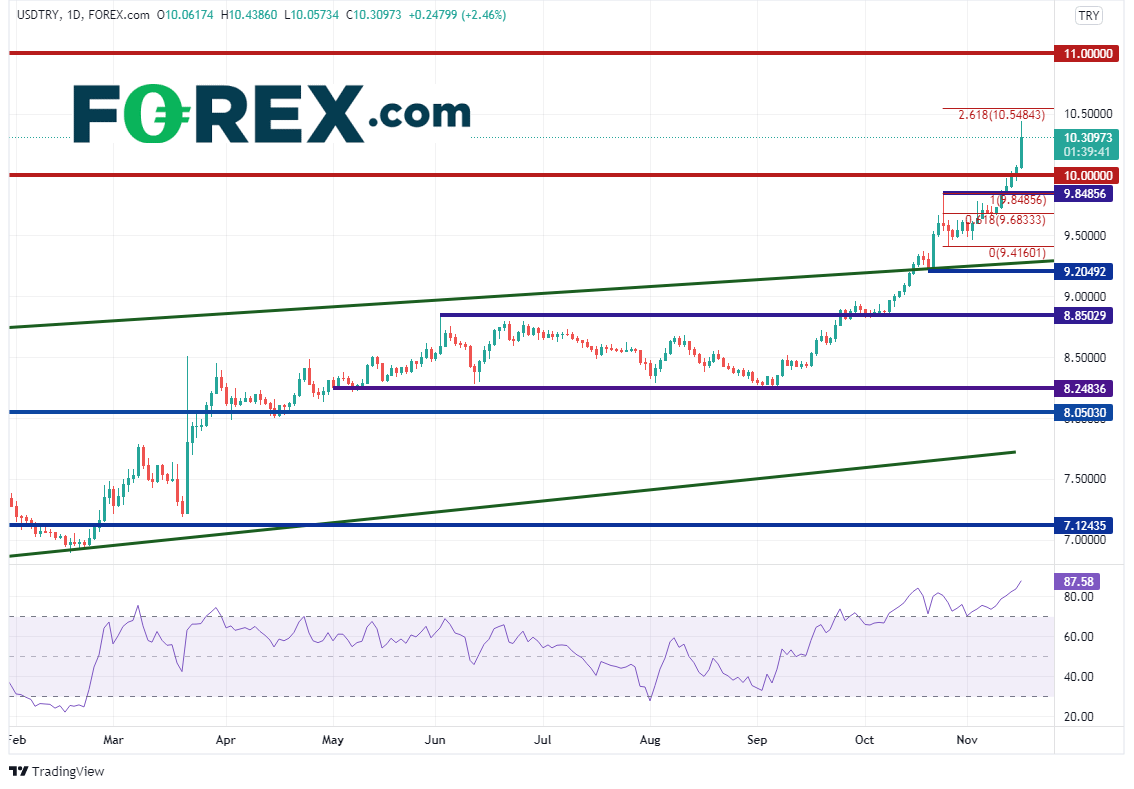
On the date of the last Central Bank meeting, USD/TRY moved aggressively above an upward sloping trendline dating back to mid-2018, near 9.2050. The pair tried to pull back 2 days later, forming a shooting star candlestick, but buyers took advantage of the pullback to add to long positions. The pair continued higher, with new highs daily. The next target is the 261.8% Fibonacci extension from the high on October 25th to the low on October 26th, near 10.5484. Above there, resistance is at the psychological round number at 11.0000. Note that the RSI is above 87, in extreme overbought conditions. However, its difficult to rely on oscillators when price is moving parabolic.
Source: Tradingview, Stone X
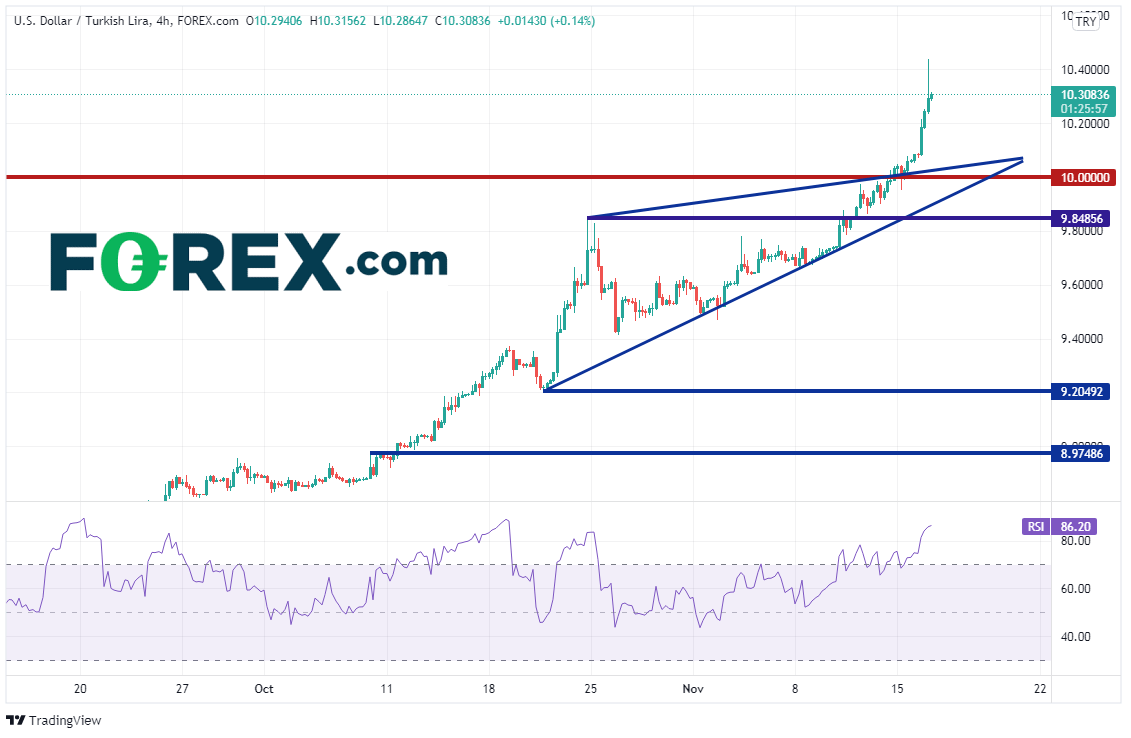
On a 240-minute timeframe, when USD/TRY broke above 10, it also moved above the top, upward sloping trendline from a rising wedge. First support is back at that trendline and the psychological round number between 10.0000 and 10.0333. Below there is the bottom trendline of the wedge near 9.90 and then horizontal support at the October 24th spike high of 9.8486. Notice that the RSI is in extreme overbought territory. However, just was with the daily, it is best not to use the RSI during parabolic moves.
Source: Tradingview, Stone X
USD/TRY has been on a parabolic move higher over the last few weeks, busting to all-time new highs above 10 and taking out stops along the way. Could this move above 10 just be a “buy the rumor, sell the fact” heading into the central bank meeting? If the central banks raise 100bps (as expected) or less, watch for the possibility that USD/TRY may sell off aggressively.
Learn more about forex trading opportunities.
USD/TRY busted through 10.00 on Monday, to close at 10.0617. On Tuesday, the pair moved aggressively higher reaching 10.4386, a daily range high of near 3.8%. The pair has been on a one-way street higher since September 7th when the USD/TRY was at 8.2718. Since then, the pair is up over 26%! What began initially as higher inflation worldwide, has turned into a one-man spectacle for President Erdogan. He has stated that he does not want the Central Bank of Turkey to raise rates, despite latest inflation readings of 19.89% YoY as of the October reading. The highest increases were in food prices. President Erdogan went as far as to fire those who were against cutting rates and replace them with those who will. Thus, at the last Central Bank of Turkey meeting, central bank officials cut rates by 200bps from 18% to 16%, well above the 50bps cut that was expected. Combine Turkey’s high inflation and rate cuts, with the US inflation (rising but much lower at 6.2%) and a US central bank in tapering/”soon to be hiking” mode, and USD/TRY is reaching new highs daily.
The Central Bank of Turkey meets again on Thursday. Expectations are for another 100bps rate cut, putting rates down to 15%. The next inflation reading isn’t until December 3rd. However, at their last meeting, the Committee noted that “till the end of the year, supply-side transitory factors leave limited room for the downward adjustment to the policy rate.” Therefore, is there a chance the committee could underwhelm the markets and cut less than 100bps? In addition, since the October 21st meeting, the Turkish Lira is down nearly 12% vs the US Dollar. It is possible that Tuesday’s aggressive move could just be a stop-run above 10.000, which will result in a “Buy the rumor, sell the fact” for USD/TRY after the meeting on Thursday.
Trade USD/TRY now: Login or Open a new account!
• Open an account in the UK
• Open an account in Australia
• Open an account in Singapore
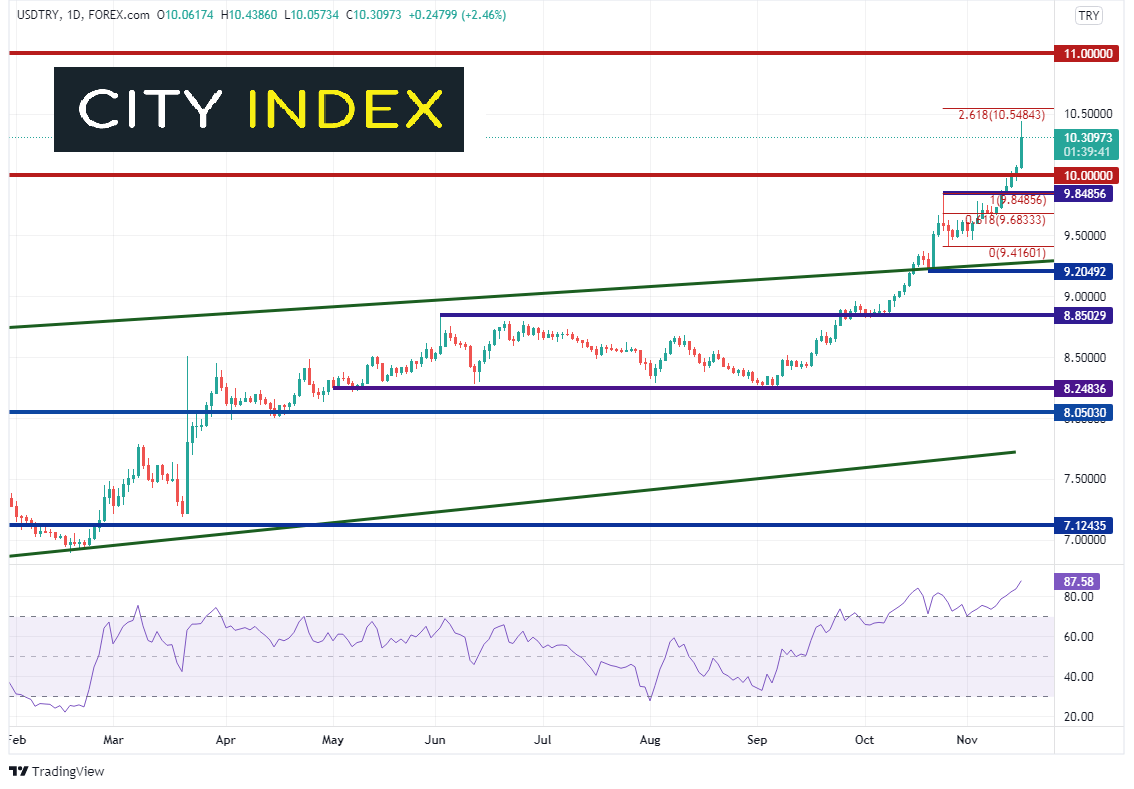
On the date of the last Central Bank meeting, USD/TRY moved aggressively above an upward sloping trendline dating back to mid-2018, near 9.2050. The pair tried to pull back 2 days later, forming a shooting star candlestick, but buyers took advantage of the pullback to add to long positions. The pair continued higher, with new highs daily. The next target is the 261.8% Fibonacci extension from the high on October 25th to the low on October 26th, near 10.5484. Above there, resistance is at the psychological round number at 11.0000. Note that the RSI is above 87, in extreme overbought conditions. However, its difficult to rely on oscillators when price is moving parabolic.
Source: Tradingview, Stone X
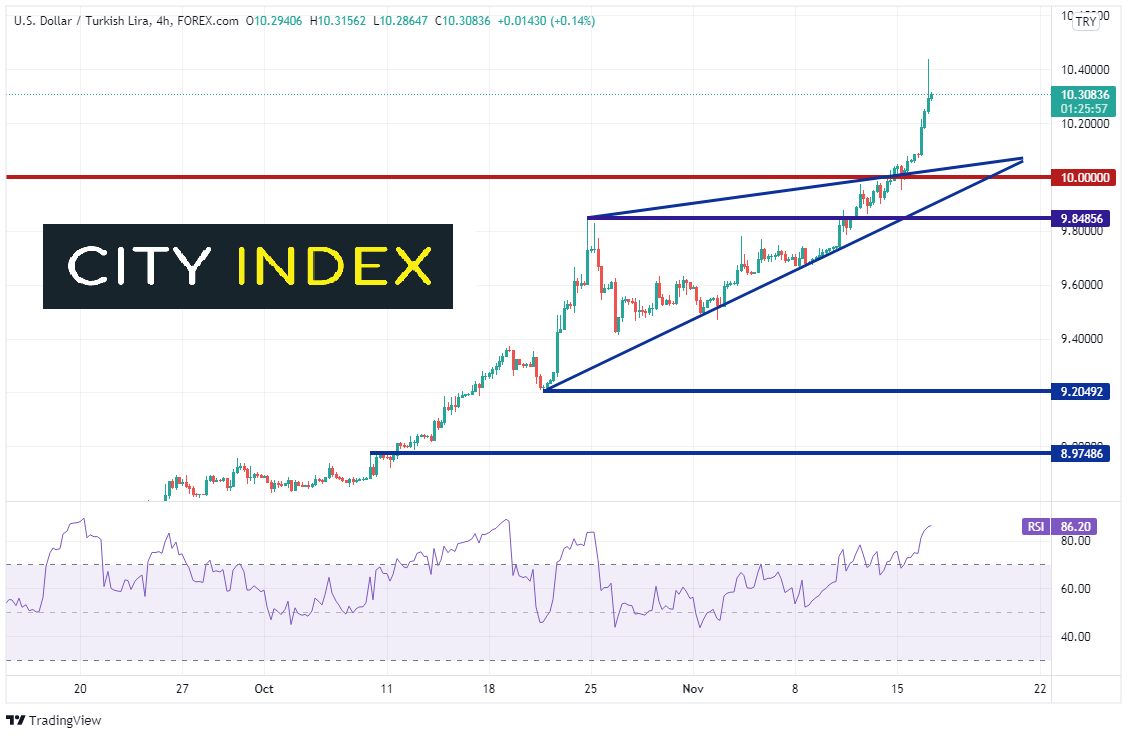
On a 240-minute timeframe, when USD/TRY broke above 10, it also moved above the top, upward sloping trendline from a rising wedge. First support is back at that trendline and the psychological round number between 10.0000 and 10.0333. Below there is the bottom trendline of the wedge near 9.90 and then horizontal support at the October 24th spike high of 9.8486. Notice that the RSI is in extreme overbought territory. However, just was with the daily, it is best not to use the RSI during parabolic moves.
Source: Tradingview, Stone X
USD/TRY has been on a parabolic move higher over the last few weeks, busting to all-time new highs above 10 and taking out stops along the way. Could this move above 10 just be a “buy the rumor, sell the fact” heading into the central bank meeting? If the central banks raise 100bps (as expected) or less, watch for the possibility that USD/TRY may sell off aggressively.
Learn more about forex trading opportunities.
Related tags:


Open an account in minutes
Experience award-winning platforms with fast and secure execution, and enjoy tight spreads from 0.5 pts on FX and 0.3 pts on indices.
Economic calendar
Web Trader platform
Our sophisticated web-based platform is packed with features.
Related articles

AUD/USD, NZD/USD Outlook: Corrective Recoveries Face Growing Headwinds
A weaker US dollar, falling Treasury yields and renewed demand for cyclical assets have supported the Aussie and Kiwi. But with some of those moves reversing on Monday, both currencies face an early test of whether their recent strength can continue.

Canadian Dollar Defies Soft CPI as Inflation Expectations Rise
The Canadian dollar strengthens despite CPI missing expectations, as rising long-term inflation expectations complicate the BoC outlook for USD/CAD and AUD/CAD.


US Dollar, GBP/USD, USD/CAD, USD/CHF, Gold Weekly Technical Outlook 10 19 2026
Sr. Technical Strategist Michael Boutros highlights the levels that matter on the USD Majors, commodities, and equity indices charts this week.

This report is intended for general circulation only. It should not be construed as a recommendation, or an offer (or solicitation of an offer) to buy or sell any financial products. The information provided does not take into account your specific investment objectives, financial situation or particular needs. Before you act on any recommendation that may be contained in this report, independent advice ought to be sought from a financial adviser regarding the suitability of the investment product, taking into account your specific investment objectives, financial situation or particular needs.
StoneX Financial Pte. Ltd., may distribute reports produced by its respective foreign entities or affiliates within the StoneX group of companies or third parties pursuant to an arrangement under Regulation 32C of the Financial Advisers Regulations. Where the report is distributed to a person in Singapore who is not an accredited investor, expert investor or an institutional investor (as defined in the Securities Futures Act), StoneX Financial Pte. Ltd. accepts legal responsibility to such persons for the contents of the report only to the extent required by law. Singapore recipients should contact StoneX Financial Pte. Ltd. at 6826 9988 for matters arising from, or in connection with the report.
In the case of all other recipients of this report, to the extent permitted by applicable laws and regulations neither StoneX Financial Pte. Ltd. nor its associated companies will be responsible or liable for any loss or damage incurred arising out of, or in connection with, any use of the information contained in this report and all such liability is hereby expressly disclaimed. No representation or warranty is made, express or implied, that the content of this report is complete or accurate.
StoneX Financial Pte. Ltd. is not under any obligation to update this report.
Trading CFDs carries a high level of risk that may not be suitable for some investors. Consider your investment objectives, level of experience, financial resources, risk appetite and other relevant circumstances carefully. The possibility exists that you could lose some or all of your investments, including your initial deposits. If in doubt, please seek independent expert advice. Visit www.forex.com/en-sg/terms-and-policies for the complete Risk Disclosure Statement.