






Weekly Technical Outlook on Stock Indices Risk of topping out in the medium term
Your weekly dose of key technical charts on S&P 500, Nikkei 225, Hang Seng, ASX 200 & DAX.
Share this:

S&P 500 – Still at risk of forming medium-term top
click to enlarge charts
Key Levels (1 to 3 weeks)
Pivot (key resistance): 3020/28 (excess)
Supports: 2957 (trigger), 2910/04 & 2875
Next resistance: 3060/88 (Fibonacci expansion)
Medium-term (1 to 3 weeks) Outlook
The SP 500 Index (proxy for the S&P 500 futures) has inched higher last week; made another fresh all-time high and challenged the 3020 key medium-term pivotal resistance as per highlighted in our previous weekly outlook report (click here for a recap).
It printed a new record intraday all-time high of 3028 on last Fri, 26 Jul before it traded back down towards 3020 in today, 29 Jul Asian session. In addition, key technical elements remain negative.
- Upside momentum has continued to wane where the bearish divergence signal seen in the daily RSI oscillator remains intact since 05 Jul 2019 coupled with weakness seen in the shorter-term 4-hour Stochastic oscillator as it has flashed a bearish divergence signal late last week at its extreme overbought level.
- One of the main catalysts that drives the S&P 500 to record new high last week was the better than expected earnings release and “not so worrisome revenue guidance” from a bellwether semiconductor stock, Texas Instrument. However, the relative strength chart of the semiconductor sector versus the S&P 500 has not broken above its previous high.
- From a contrarian opinion perspective, the VIX futures has managed to stage a bounce last Fri, 26 Jul at the upper limit of it “complacency zone” of 12.80/10.10. Therefore, the risk of a of a multi-week corrective decline in the S&P 500 still prevails.
Therefore, we maintain the bearish bias and tolerate the excess to 3028 and added a downside trigger level at 2957. A break with an hourly close below 2957 reinforces the potential corrective down move to target the 2910/04 support follow by 2875 next (also the 50% Fibonacci retracement of the recent up move from 03 Jun low to 27 Jul 2019 high).
On the other hand, a clearance with a daily close above 3028 invalidates the bearish scenario for a squeeze up towards the next resistance at 3060/88.
Nikkei 225 – Retreated below 21900/222000 key range resistance
click to enlarge charts
Key Levels (1 to 3 weeks)
Pivot (key resistance): 21900/22000
Support: 21400 (trigger) & 20900/800
Next resistance: 23050 (LT pivot)
Medium-term (1 to 3 weeks) Outlook
The Japan 225 Index (proxy for the Nikkei 225 futures) has staged a squeezed on last week to print a high of 21830 on Thurs, 25 Jul.
Interestingly, the Index has started to retreat by -1.43% from last Thurs, 25 Jul high of 21830 which is right below the 21900/22000 key medium-term range resistance. Therefore, we maintain the bearish bias and ended 21400 as the downside trigger level. A break with an hourly close below 21400 is likely to see another corrective decline towards the next support at 20900/800 in the first step within a complex range configuration.
On the other hand, a clearance with a daily close above 22000 invalidates the bearish scenario for a further push up to challenge the 23050 long-term pivotal resistance set for Q3 2019.
Hang Seng – Further potential corrective decline validated
click to enlarge charts
Key Levels (1 to 3 weeks)
Intermediate resistance: 28500
Pivot (key resistance): 29000
Supports: 27800 & 26700
Next resistance: 29500/700
Medium-term (1 to 3 weeks) Outlook
The Hong Kong 50 Index (proxy for Hang Seng Index futures) has staged the bearish breakdown below 28300 (the lower limit of the neutrality range as per highlighted in our previous report).
We flip back to a bearish bias in any bounces below the 29000 key medium-term pivotal resistance for a further potential push down to target the next supports at 27800 and 26700 within a multi-week corrective decline sequence in place since 19 Jul 2019 high.
On the other hand, a clearance with a daily close above 29000 invalidates the bearish scenario for a squeeze up to target 29500/700 next.
ASX 200 – At risk of a multi-week corrective decline
click to enlarge charts
Key Levels (1 to 3 weeks)
Pivot (key resistance): 6851
Supports: 6765 (trigger) & 6620
Next resistance: 6985 (Fibonacci expansion cluster)
Medium-term (1 to 3 weeks) Outlook
The Australia 200 Index (proxy for the ASX 200 futures) has staged the expected rally and hit the lower limit of the 6815/50 target/resistance zone as per highlighted in our previous report.
Both the daily RSI and 4-hour Stochastic oscillators are coming close to their respective extreme overbought levels with the price action of the Index right below the upper boundary of a medium-term ascending channel in place since 27 Mar 2019 low.
Also, Elliot Wave/fractal analysis suggests that the intermediate degree impulsive up move sequence, wave 3/ in place since 14 May 2019 low of 6203 may have ended where a potential multi-week corrective decline wave 4/ sequence should unfold next.
Therefore, we flip to a bearish bias below the 6851 key medium-term pivotal resistance and an hourly close below 6765 is likely to reinforce a corrective decline to target the next support at 6620.
On the other hand, a clearance with a daily close above 6851 invalidates the bearish scenario to see an extended impulsive up move towards 6985.
DAX – Mix elements; sideways
click to enlarge charts
Key Levels (1 to 3 weeks)
Resistances: 12600 & 12800
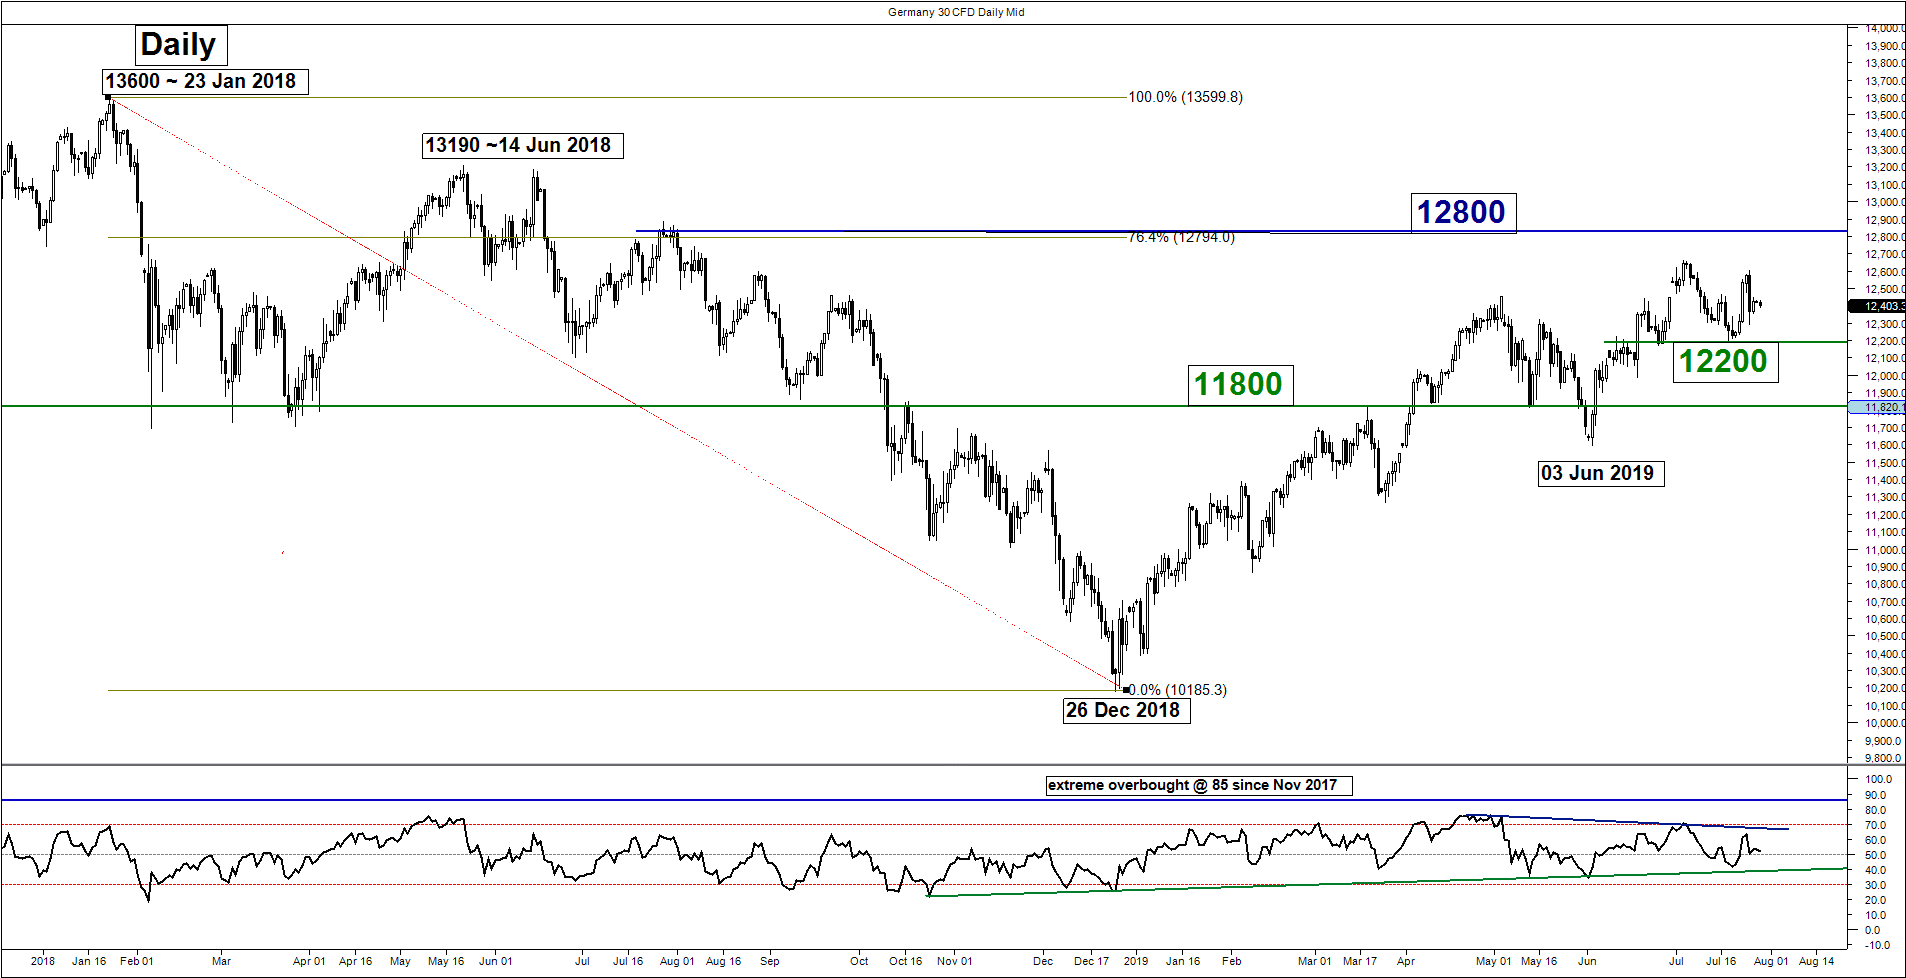
Supports: 12200 & 11800
Medium-term (1 to 3 weeks) Outlook
Last week, the Germany 30 Index (proxy for the DAX futures) has managed to stage a push up and stalled a descending trendline in place since 04 Jul 2019 high.
Mix elements at this juncture, thus prefer to turn neutral between 12600 (the descending trendline resistance) and 12200. Only a break below 12200 opens up scope for a corrective decline towards the 11800 major support.
On the flipside, a clearance above 12600 sees a squeeze up towards the next resistance at 12800 (also the 76.4% Fibonacci retracement of the previous major degree down move from 23 Jan 2018 high to 26 Dec 2018 low).
Charts are from City Index Advantage TraderPro & eSignal
S&P 500 – Still at risk of forming medium-term top
click to enlarge charts
Key Levels (1 to 3 weeks)
Pivot (key resistance): 3020/28 (excess)
Supports: 2957 (trigger), 2910/04 & 2875
Next resistance: 3060/88 (Fibonacci expansion)
Medium-term (1 to 3 weeks) Outlook
The SP 500 Index (proxy for the S&P 500 futures) has inched higher last week; made another fresh all-time high and challenged the 3020 key medium-term pivotal resistance as per highlighted in our previous weekly outlook report (click here for a recap).
It printed a new record intraday all-time high of 3028 on last Fri, 26 Jul before it traded back down towards 3020 in today, 29 Jul Asian session. In addition, key technical elements remain negative.
- Upside momentum has continued to wane where the bearish divergence signal seen in the daily RSI oscillator remains intact since 05 Jul 2019 coupled with weakness seen in the shorter-term 4-hour Stochastic oscillator as it has flashed a bearish divergence signal late last week at its extreme overbought level.
- One of the main catalysts that drives the S&P 500 to record new high last week was the better than expected earnings release and “not so worrisome revenue guidance” from a bellwether semiconductor stock, Texas Instrument. However, the relative strength chart of the semiconductor sector versus the S&P 500 has not broken above its previous high.
- From a contrarian opinion perspective, the VIX futures has managed to stage a bounce last Fri, 26 Jul at the upper limit of it “complacency zone” of 12.80/10.10. Therefore, the risk of a of a multi-week corrective decline in the S&P 500 still prevails.
Therefore, we maintain the bearish bias and tolerate the excess to 3028 and added a downside trigger level at 2957. A break with an hourly close below 2957 reinforces the potential corrective down move to target the 2910/04 support follow by 2875 next (also the 50% Fibonacci retracement of the recent up move from 03 Jun low to 27 Jul 2019 high).
On the other hand, a clearance with a daily close above 3028 invalidates the bearish scenario for a squeeze up towards the next resistance at 3060/88.
Nikkei 225 – Retreated below 21900/222000 key range resistance
click to enlarge charts
Key Levels (1 to 3 weeks)
Pivot (key resistance): 21900/22000
Support: 21400 (trigger) & 20900/800
Next resistance: 23050 (LT pivot)
Medium-term (1 to 3 weeks) Outlook
The Japan 225 Index (proxy for the Nikkei 225 futures) has staged a squeezed on last week to print a high of 21830 on Thurs, 25 Jul.
Interestingly, the Index has started to retreat by -1.43% from last Thurs, 25 Jul high of 21830 which is right below the 21900/22000 key medium-term range resistance. Therefore, we maintain the bearish bias and ended 21400 as the downside trigger level. A break with an hourly close below 21400 is likely to see another corrective decline towards the next support at 20900/800 in the first step within a complex range configuration.
On the other hand, a clearance with a daily close above 22000 invalidates the bearish scenario for a further push up to challenge the 23050 long-term pivotal resistance set for Q3 2019.
Hang Seng – Further potential corrective decline validated
click to enlarge charts
Key Levels (1 to 3 weeks)
Intermediate resistance: 28500
Pivot (key resistance): 29000
Supports: 27800 & 26700
Next resistance: 29500/700
Medium-term (1 to 3 weeks) Outlook
The Hong Kong 50 Index (proxy for Hang Seng Index futures) has staged the bearish breakdown below 28300 (the lower limit of the neutrality range as per highlighted in our previous report).
We flip back to a bearish bias in any bounces below the 29000 key medium-term pivotal resistance for a further potential push down to target the next supports at 27800 and 26700 within a multi-week corrective decline sequence in place since 19 Jul 2019 high.
On the other hand, a clearance with a daily close above 29000 invalidates the bearish scenario for a squeeze up to target 29500/700 next.
ASX 200 – At risk of a multi-week corrective decline
click to enlarge charts
Key Levels (1 to 3 weeks)
Pivot (key resistance): 6851
Supports: 6765 (trigger) & 6620
Next resistance: 6985 (Fibonacci expansion cluster)
Medium-term (1 to 3 weeks) Outlook
The Australia 200 Index (proxy for the ASX 200 futures) has staged the expected rally and hit the lower limit of the 6815/50 target/resistance zone as per highlighted in our previous report.
Both the daily RSI and 4-hour Stochastic oscillators are coming close to their respective extreme overbought levels with the price action of the Index right below the upper boundary of a medium-term ascending channel in place since 27 Mar 2019 low.
Also, Elliot Wave/fractal analysis suggests that the intermediate degree impulsive up move sequence, wave 3/ in place since 14 May 2019 low of 6203 may have ended where a potential multi-week corrective decline wave 4/ sequence should unfold next.
Therefore, we flip to a bearish bias below the 6851 key medium-term pivotal resistance and an hourly close below 6765 is likely to reinforce a corrective decline to target the next support at 6620.
On the other hand, a clearance with a daily close above 6851 invalidates the bearish scenario to see an extended impulsive up move towards 6985.
DAX – Mix elements; sideways
click to enlarge charts
Key Levels (1 to 3 weeks)
Resistances: 12600 & 12800
Supports: 12200 & 11800
Medium-term (1 to 3 weeks) Outlook
Last week, the Germany 30 Index (proxy for the DAX futures) has managed to stage a push up and stalled a descending trendline in place since 04 Jul 2019 high.
Mix elements at this juncture, thus prefer to turn neutral between 12600 (the descending trendline resistance) and 12200. Only a break below 12200 opens up scope for a corrective decline towards the 11800 major support.
On the flipside, a clearance above 12600 sees a squeeze up towards the next resistance at 12800 (also the 76.4% Fibonacci retracement of the previous major degree down move from 23 Jan 2018 high to 26 Dec 2018 low).
Charts are from City Index Advantage TraderPro & eSignal
Related tags:




Open an account in minutes
Experience award-winning platforms with fast and secure execution, and enjoy tight spreads from 0.5 pts on FX and 0.3 pts on indices.
Economic calendar
Web Trader platform
Our sophisticated web-based platform is packed with features.
Related articles

Oil Shock Hits Bond Yields and Squeezes the Consumer
U.S. 10-year and 30-year bond yields have moved higher as markets reopen after the Labor Day weekend, with the producer price index and the consumer price index landing within days of each other. The European Central Bank decision sits between them, where the economic projections and Christine Lagarde's press conference carry more market risk than the rate move itself. The DAX has also broken below its 21-day exponential moving average, a sign that momentum beneath a resilient index is starting to fade.


DAX, Crude oil forecast: Rising energy prices, yields threaten risk assets
Following a weak handover from Asia, European markets and US indices were under pressure this morning, as rising oil prices and elevated bond yields once again weighed on risk appetite. Among the major European indices, the German DAX will be in firm focus this week, with the ECB’s rate decision coming up on Thursday. That decision is likely to be a hike, as rising oil prices threaten to re-accelerate inflation.

Nikkei 225 Eyes Wall Street Bounce Ahead of NFP
Wall Street rebounds as Fed hike bets ease, while Nikkei 225 futures eye 66k resistance ahead of US nonfarm payrolls.

This report is intended for general circulation only. It should not be construed as a recommendation, or an offer (or solicitation of an offer) to buy or sell any financial products. The information provided does not take into account your specific investment objectives, financial situation or particular needs. Before you act on any recommendation that may be contained in this report, independent advice ought to be sought from a financial adviser regarding the suitability of the investment product, taking into account your specific investment objectives, financial situation or particular needs.
StoneX Financial Pte. Ltd., may distribute reports produced by its respective foreign entities or affiliates within the StoneX group of companies or third parties pursuant to an arrangement under Regulation 32C of the Financial Advisers Regulations. Where the report is distributed to a person in Singapore who is not an accredited investor, expert investor or an institutional investor (as defined in the Securities Futures Act), StoneX Financial Pte. Ltd. accepts legal responsibility to such persons for the contents of the report only to the extent required by law. Singapore recipients should contact StoneX Financial Pte. Ltd. at 6826 9988 for matters arising from, or in connection with the report.
In the case of all other recipients of this report, to the extent permitted by applicable laws and regulations neither StoneX Financial Pte. Ltd. nor its associated companies will be responsible or liable for any loss or damage incurred arising out of, or in connection with, any use of the information contained in this report and all such liability is hereby expressly disclaimed. No representation or warranty is made, express or implied, that the content of this report is complete or accurate.
StoneX Financial Pte. Ltd. is not under any obligation to update this report.
Trading CFDs carries a high level of risk that may not be suitable for some investors. Consider your investment objectives, level of experience, financial resources, risk appetite and other relevant circumstances carefully. The possibility exists that you could lose some or all of your investments, including your initial deposits. If in doubt, please seek independent expert advice. Visit www.forex.com/en-sg/terms-and-policies for the complete Risk Disclosure Statement.