



Zoom Video Q4 preview: Where next for Zoom stock?
Zoom has fallen out of favour as investors continue to move out of stay-at-home stocks, but has the heavy selloff in Zoom shares been overdone?
Share this:

When will Zoom report Q4 earnings?
Zoom Video Communications will report fourth quarter and full year results covering the year to the end of January 2022 after US markets close on Monday February 28.
Zoom Video Q4 preview
Zoom Video shares still trade well above pre-pandemic levels but have plunged over 77% since peaking at the height of the coronavirus crisis in 2020. The surge in interest in stay-at-home stocks during lockdown meant the company boasted a valuation of over $159 billion back in October 2020 but today that sits closer to $38 billion.
Zoom believes it is in the perfect position to capitalise on the structural changes the pandemic is causing by normalising remote and hybrid working and growing the need for unified communications to bring everything altogether, but that has not stopped it losing allure with investors as offices continue to reopen and they shift their money into stocks with greater recovery potential.
Plus, it is clear that the hype around Zoom caused its valuation to spiral to unprecedented heights during 2020. Its valuation looks far more realistic today considering it is equal to around 26x forecasted EPS in 2021. That compares to the 32x trailing 12-month average of the Nasdaq 100 and the 38x of the Nasdaq 100 Tech Sector Index, according to Bloomberg figures. In fact, brokers argue the selloff in Zoom Video shares over the past 16 months has been overdone considering the average target price of $279 implies the stock can more than double over the next 12 months – but the most recent updates implies there is more moderate upside potential with target prices coming in below $200.
Growth is understandably experiencing a slowdown as Zoom comes up against the tough comparatives seen when demand exploded in 2020 as businesses rushed to shift online and needed remote communication systems and this will continue to weigh on sentiment until things normalise and the rate of growth stabilises.
Wall Street forecasts Zoom will report a 19% year-on-year rise in fourth quarter revenue to $1.05 billion, broadly level with the previous quarter but marking the slowest year-on-year growth in 2021.
The number of customers with over 10 employees is expected to have risen to 527,303 by the end of December from 467,100 a year earlier, while the number that contribute over $100,000 in annual revenue for Zoom is expected to rise to 2,735 from 1,644. Meeting these targets is key to installing confidence that larger businesses continue to regard Zoom as an indispensable tool even as the pandemic eases. Although it is still delivering significant growth in the amount of larger customers it has on its books, the rate of acquisition is also slowing.
Diluted net income per share is expected to drop 12% year-on-year to $1.07, also marking its weakest quarterly profit performance in over a year.
For the full year, Zoom has said it is targeting revenue of $4.079 to $4.081 billion and EPS of $4.84 to $4.85. That would be up from just $2.65 billion in revenue and EPS of $3.34 in the previous financial year.
Investors understand growth will continue to slow in the current year. Wall Street currently forecasts revenue will grow just 16% in the year to the end of January 2023 and that EPS will fall 8.4%. With that in mind, they will want to see some new catalysts introduced to help prop-up growth and that may come in the form of M&A. Five9 shareholders rejected the deal tabled by Zoom to merge the two companies together last year and it is likely that Zoom is still keen on expanding into the Contact Centre-as-a-Service (CCaaS) market and bundling its products with more services to widen appeal and make it more vital for businesses around the world.
Where next for ZM stock?
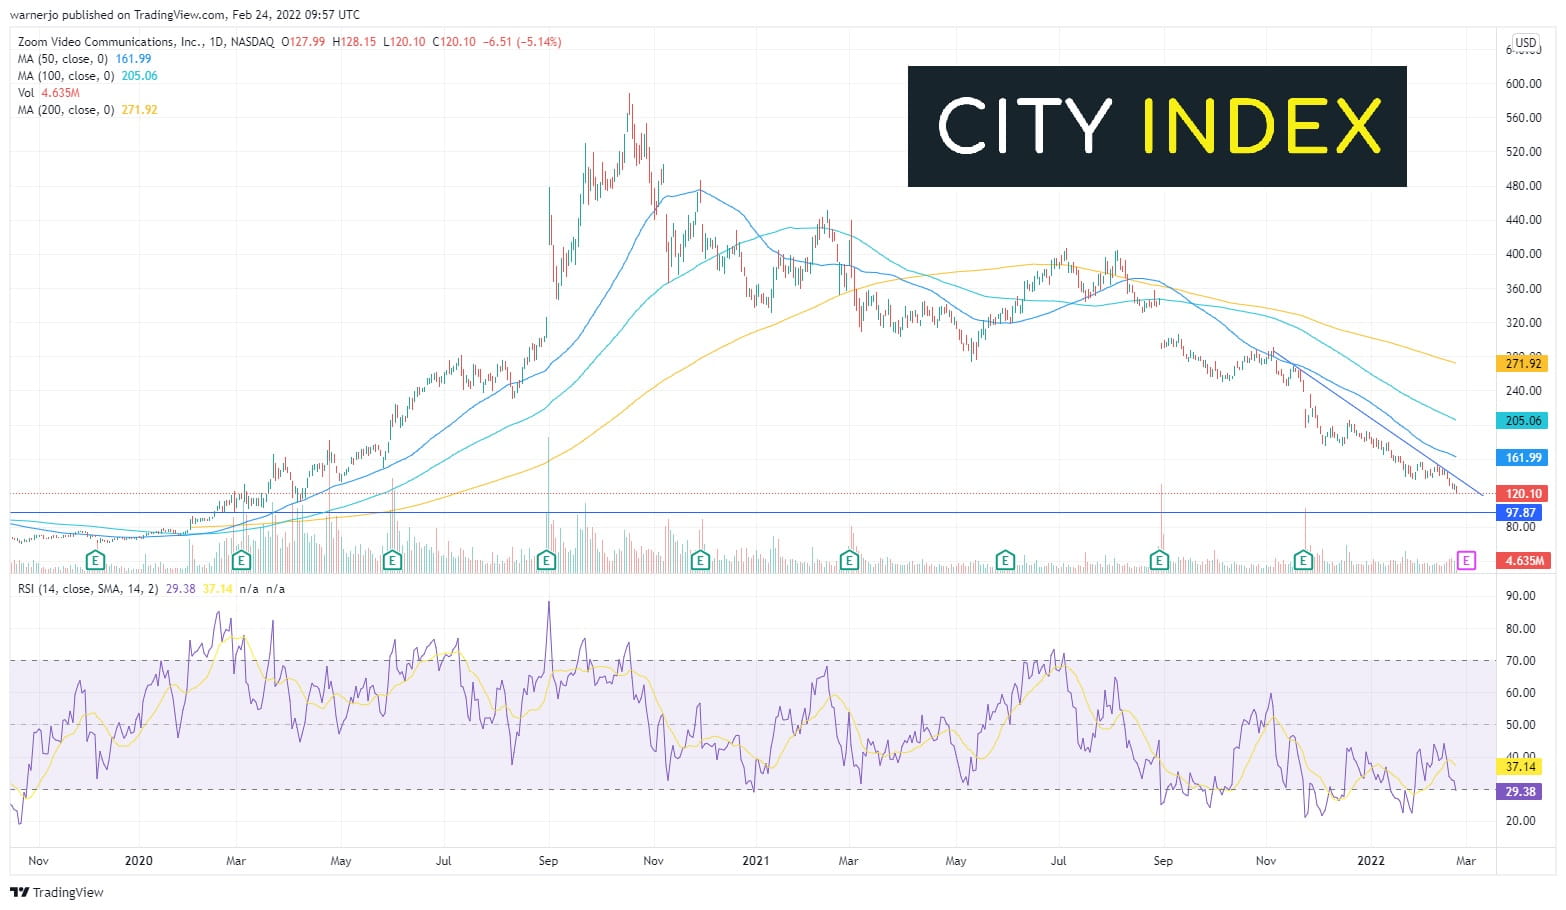
Zoom shares have been steadily falling since peaking back in October 2020, with the most recent downtrend having started in early November 2021. Shares currently trade at a 22-month low, having given back the vast majority of gains booked throughout the pandemic.
We could see the stock continue to decline toward the $97 level of support that emerged in February 2020 if the current downtrend continues, with a move below $100 likely to break a key psychological barrier. The fact the 50-day sma continues to trade below the 100-day sma (which in turn remains below the 200-day sma) supports the view that the stock could continue to come under pressure going forward.
However, there are signs that the current downtrend is running out of steam. The fact the stock has slipped lower despite the RSI rising higher signals a bullish divergence and the RSI has just slipped into oversold territory. Average volumes have also declined over the past 100 days.
The stock needs to break out of the most recent downtrend to signal a move higher. Shares have struggled to remain above the 50-day sma, which currently sits at $162, for too long over the last five months so this is the first level that needs to be recaptured. That would be significant considering it would open the door to the 100-day sma at $205, in-line with the December high.
How to trade Zoom stock
You can trade Zoom shares with City Index in just four easy steps:
- Open a City Index account, or log-in if you’re already a customer.
- Search for ‘Zoom Video’ in our award-winning platform
- Choose your position and size, and your stop and limit levels
- Place the trade
Or you can try out your trading strategy risk-free by signing up for our Demo Trading Account.
You can trade Zoom shares with Forex.com in just four steps:
- Open a Forex.com account, or log-in if you’re already a customer.
- Search for ‘Zoom Video’ in our award-winning platform
- Choose your position and size, and your stop and limit levels
- Place the trade
Or you can try out your trading strategy risk-free by signing up for our Demo Account.


Open an account in minutes
Experience award-winning platforms with fast and secure execution, and enjoy tight spreads from 0.5 pts on FX and 0.3 pts on indices.
Economic calendar
Web Trader platform
Our sophisticated web-based platform is packed with features.
Related articles
USD/CAD shooting star puts September surge on notice
USD/CAD has printed a clear bearish reversal pattern after an extraordinary September surge, but confirmation may depend heavily on how US Treasury yields react to Friday’s payrolls report.

USD/CHF Reverses as Swiss Franc Surges amid Bond Carnage
USD/CHF reverses from channel resistance as bond volatility surges and broad Swiss franc strength points to a possible carry-trade unwind.


Gold Price Forecast: XAU/USD Plunges 12.4% Toward Critical Support 10 1 2026
Softer inflation has revived expectations for a Fed pause, but Friday’s payrolls could put gold’s recovery prospects to the test.

This report is intended for general circulation only. It should not be construed as a recommendation, or an offer (or solicitation of an offer) to buy or sell any financial products. The information provided does not take into account your specific investment objectives, financial situation or particular needs. Before you act on any recommendation that may be contained in this report, independent advice ought to be sought from a financial adviser regarding the suitability of the investment product, taking into account your specific investment objectives, financial situation or particular needs.
StoneX Financial Pte. Ltd., may distribute reports produced by its respective foreign entities or affiliates within the StoneX group of companies or third parties pursuant to an arrangement under Regulation 32C of the Financial Advisers Regulations. Where the report is distributed to a person in Singapore who is not an accredited investor, expert investor or an institutional investor (as defined in the Securities Futures Act), StoneX Financial Pte. Ltd. accepts legal responsibility to such persons for the contents of the report only to the extent required by law. Singapore recipients should contact StoneX Financial Pte. Ltd. at 6826 9988 for matters arising from, or in connection with the report.
In the case of all other recipients of this report, to the extent permitted by applicable laws and regulations neither StoneX Financial Pte. Ltd. nor its associated companies will be responsible or liable for any loss or damage incurred arising out of, or in connection with, any use of the information contained in this report and all such liability is hereby expressly disclaimed. No representation or warranty is made, express or implied, that the content of this report is complete or accurate.
StoneX Financial Pte. Ltd. is not under any obligation to update this report.
Trading CFDs carries a high level of risk that may not be suitable for some investors. Consider your investment objectives, level of experience, financial resources, risk appetite and other relevant circumstances carefully. The possibility exists that you could lose some or all of your investments, including your initial deposits. If in doubt, please seek independent expert advice. Visit www.forex.com/en-sg/terms-and-policies for the complete Risk Disclosure Statement.