




Why Bears May Want to Be Cautious on the Dollar Index Breakdown
The dollar index has broken down from a rising wedge pattern, but 98.00 may be the important level to watch.
Share this:

As has consistently been the case over the last couple of years, Friday’s US-China trade “breakthrough” may be less than initially meets the eye. While President Trump praised the agreement as a “love fest” between the US and China, Chinese press was more levelheaded, noting that nothing has even been signed yet.
At the end of the day, cooperation that allows China to buy more US agricultural goods (given the country’s food shortage) and the US to delay tariff escalation benefits both sides, but more contentious issues surrounding intellectual property and forced technology transfers could still torpedo a more comprehensive agreement in the coming months.
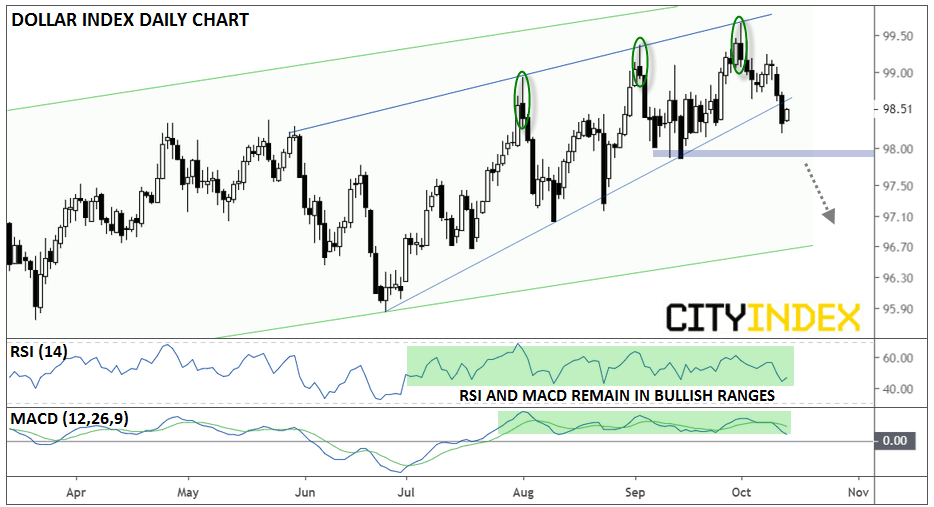
In any event, Friday’s risk-on trading session prompted traders to sell the greenback, prompting the US dollar index to break down from its four-month rising wedge pattern. Despite the seemingly bullish name, this price action pattern shows that buyers are struggling to push the price higher on each subsequent swing. It is a classic sign of waning buying pressure and often portends a bearish reversal:
Source: Trading View, City Index
While the price pattern itself is potentially bearish, readers may want to exercise some caution. For the momentum, the dollar index remains in a textbook uptrend (higher highs and higher lows) and neither the RSI nor MACD indicators have broken down from their recent bullish ranges.
For bears to truly feel comfortable pushing the greenback lower, they’d need to see the dollar index break below its September lows in the 97.90-98.00 range (the equivalent zone in EUR/USD is around 1.1090-1.1100). Unless or until we get a stronger technical signal, traders may want to keep a neutral outlook toward the US dollar generally, despite last week’s breakdown.
As has consistently been the case over the last couple of years, Friday’s US-China trade “breakthrough” may be less than initially meets the eye. While President Trump praised the agreement as a “love fest” between the US and China, Chinese press was more levelheaded, noting that nothing has even been signed yet.
At the end of the day, cooperation that allows China to buy more US agricultural goods (given the country’s food shortage) and the US to delay tariff escalation benefits both sides, but more contentious issues surrounding intellectual property and forced technology transfers could still torpedo a more comprehensive agreement in the coming months.
In any event, Friday’s risk-on trading session prompted traders to sell the greenback, prompting the US dollar index to break down from its four-month rising wedge pattern. Despite the seemingly bullish name, this price action pattern shows that buyers are struggling to push the price higher on each subsequent swing. It is a classic sign of waning buying pressure and often portends a bearish reversal:
Source: Trading View, FOREX.com
While the price pattern itself is potentially bearish, readers may want to exercise some caution. For the momentum, the dollar index remains in a textbook uptrend (higher highs and higher lows) and neither the RSI nor MACD indicators have broken down from their recent bullish ranges.
For bears to truly feel comfortable pushing the greenback lower, they’d need to see the dollar index break below its September lows in the 97.90-98.00 range (the equivalent zone in EUR/USD is around 1.1090-1.1100). Unless or until we get a stronger technical signal, traders may want to keep a neutral outlook toward the US dollar generally, despite last week’s breakdown.


Open an account in minutes
Experience award-winning platforms with fast and secure execution, and enjoy tight spreads from 0.5 pts on FX and 0.3 pts on indices.
Economic calendar
Web Trader platform
Our sophisticated web-based platform is packed with features.
Related articles

USD/CAD forecast: rally could accelerate above June highs at 1.4250
USD/CAD recovered quickly after weaker US jobs data, keeping the bullish trend in focus. A move above the June highs could accelerate the rally as inflation keeps the Fed under pressure.


USD Sets Fresh Yearly High as EUR/USD Drops Dramatically, USD/JPY Stable
Well, it was a week of USD strength that wasn’t entirely pushed by USD/JPY, as a strong sell-off in EUR/USD has pushed the major pair to its most oversold state in a decade.


USD/CAD shooting star puts September surge on notice
USD/CAD has printed a clear bearish reversal pattern after an extraordinary September surge, but confirmation may depend heavily on how US Treasury yields react to Friday’s payrolls report.

This report is intended for general circulation only. It should not be construed as a recommendation, or an offer (or solicitation of an offer) to buy or sell any financial products. The information provided does not take into account your specific investment objectives, financial situation or particular needs. Before you act on any recommendation that may be contained in this report, independent advice ought to be sought from a financial adviser regarding the suitability of the investment product, taking into account your specific investment objectives, financial situation or particular needs.
StoneX Financial Pte. Ltd., may distribute reports produced by its respective foreign entities or affiliates within the StoneX group of companies or third parties pursuant to an arrangement under Regulation 32C of the Financial Advisers Regulations. Where the report is distributed to a person in Singapore who is not an accredited investor, expert investor or an institutional investor (as defined in the Securities Futures Act), StoneX Financial Pte. Ltd. accepts legal responsibility to such persons for the contents of the report only to the extent required by law. Singapore recipients should contact StoneX Financial Pte. Ltd. at 6826 9988 for matters arising from, or in connection with the report.
In the case of all other recipients of this report, to the extent permitted by applicable laws and regulations neither StoneX Financial Pte. Ltd. nor its associated companies will be responsible or liable for any loss or damage incurred arising out of, or in connection with, any use of the information contained in this report and all such liability is hereby expressly disclaimed. No representation or warranty is made, express or implied, that the content of this report is complete or accurate.
StoneX Financial Pte. Ltd. is not under any obligation to update this report.
Trading CFDs carries a high level of risk that may not be suitable for some investors. Consider your investment objectives, level of experience, financial resources, risk appetite and other relevant circumstances carefully. The possibility exists that you could lose some or all of your investments, including your initial deposits. If in doubt, please seek independent expert advice. Visit www.forex.com/en-sg/terms-and-policies for the complete Risk Disclosure Statement.