



With elections out of the way the Norwegian Krone looks at oil and the Norges Bank
USD/NOK seems to have reverted to its normal self, which is trading inversely to oil and a hawkish central bank
Share this:

Norway held elections on Monday, and the results were “as expected”, with the Labor party, along with the Socialist Left and the Center Party, clinching victory over Conservatives in a race that was primarily dominated by the country’s future in oil. The Labor Party campaigned on new green industries. However, with WTI Crude Oil up 2.5% today, that didn’t stop the oil export-led country’s currency from strengthening. Add in a hawkish Norges Bank, which is expected to hike rates next week from 0% to 0.25%, and there is good reason for the Norwegian Krone to go bid!
Trade USD/NOK now: Login or Open a new account!
• Open an account in the UK
• Open an account in Australia
• Open an account in Singapore
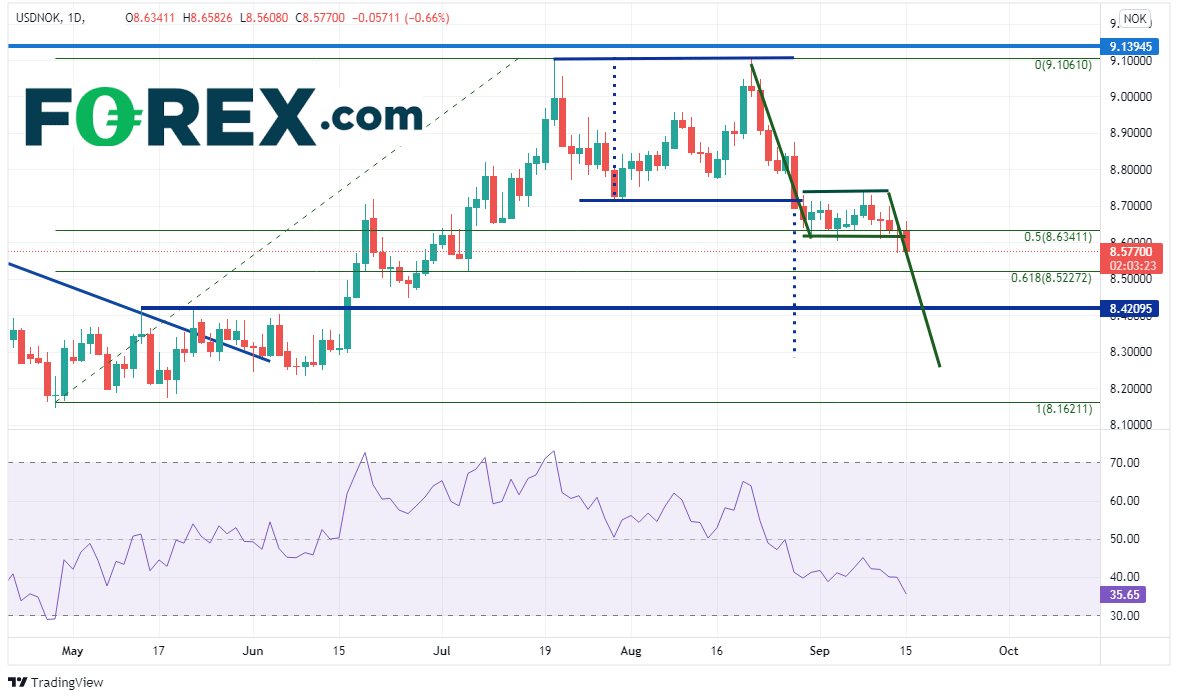
On a daily timeframe, USD/NOK formed a double top when price broke below the neckline of the formation on August 27th at 8.7153. The second candlestick at the top of the formation was an evening star, which indicated the possibility of a reversal ahead. The target for a double top pattern is the distance of the height of the pattern added to the breakout point, which is near 8.3025. After USD/NOK broke the neckline, price began trading sideways at the 50% retracement level from the April 29th lows to the double top highs near 8.634 as traders waited for election day. This formed a flag pattern. Upon confirmation of the “as expected” results, USD/NOK continued its move lower and price broke below the bottom trendline of the flag on Tuesday, which continued today. The target for a flag pattern is the distance of the flag “pole” added to the breakdown point, which is near 8.2605.
Source: Tradingview, Stone X
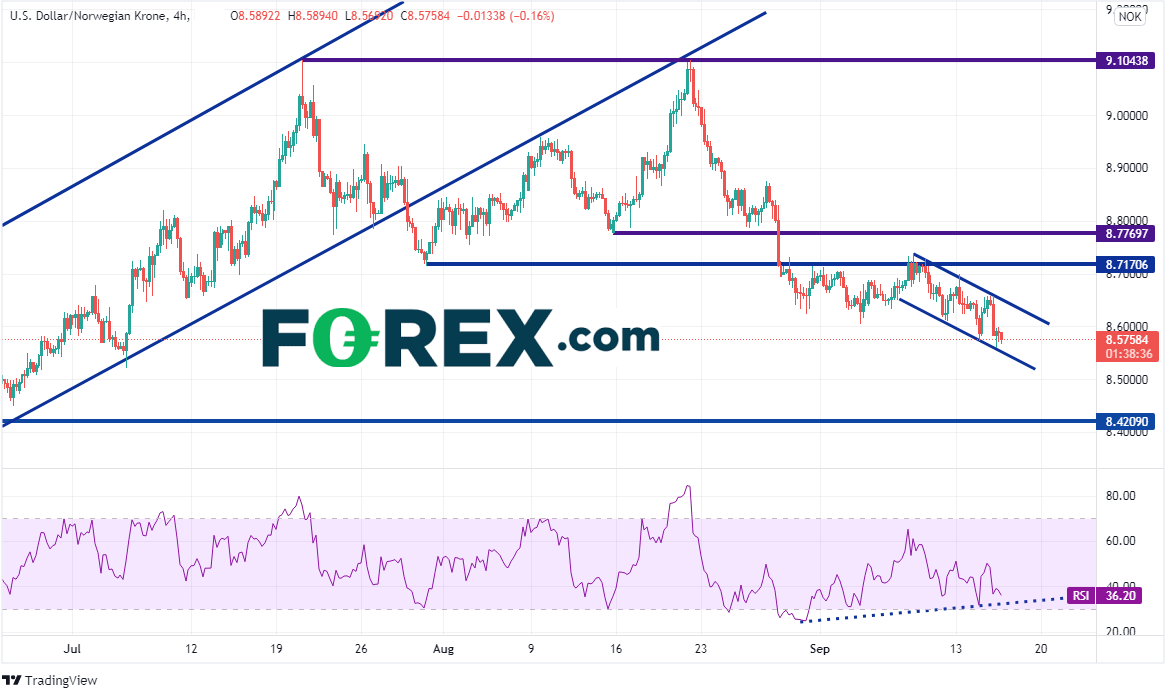
On a 240-minute timeframe, price moved lower out of the flag pattern in an orderly downward channel formation. Support is at the bottom trendline of the channel near 8.5608. Below there, support is at the 61.8% Fibonacci retracement level from the previously mentioned timeframe (on the daily chart) near 8.523 and then horizontal support at 8.4209. However, notice that the RSI is diverging from price. This is an indication that USD/NOK may be ready to bounce to the top trendline of the channel, near 8.6409. If price fails to continue lower, horizontal resistance above is at the September 8th highs of 8.772. Additional horizontal resistance is at 8.7770.
Source: Tradingview, Stone X
With elections out of the way, USD/NOK seems to have reverted to its normal self, which is trading inversely to oil and a hawkish central bank. If oil continues to strengthen or if the Norges Bank indicates next week that they may hike again in the coming moths (ie remains hawkish), USD/NOK move to the double top target and flag target quite rapidly!
Learn more about forex trading opportunities.
Norway held elections on Monday, and the results were “as expected”, with the Labor party, along with the Socialist Left and the Center Party, clinching victory over Conservatives in a race that was primarily dominated by the country’s future in oil. The Labor Party campaigned on new green industries. However, with WTI Crude Oil up 2.5% today, that didn’t stop the oil export-led country’s currency from strengthening. Add in a hawkish Norges Bank, which is expected to hike rates next week from 0% to 0.25%, and there is good reason for the Norwegian Krone to go bid!
Trade USD/NOK now: Login or open a new account!
On a daily timeframe, USD/NOK formed a double top when price broke below the neckline of the formation on August 27th at 8.7153. The second candlestick at the top of the formation was an evening star, which indicated the possibility of a reversal ahead. The target for a double top pattern is the distance of the height of the pattern added to the breakout point, which is near 8.3025. After USD/NOK broke the neckline, price began trading sideways at the 50% retracement level from the April 29th lows to the double top highs near 8.634 as traders waited for election day. This formed a flag pattern. Upon confirmation of the “as expected” results, USD/NOK continued its move lower and price broke below the bottom trendline of the flag on Tuesday, which continued today. The target for a flag pattern is the distance of the flag “pole” added to the breakdown point, which is near 8.2605.
Source: Tradingview, Stone X
On a 240-minute timeframe, price moved lower out of the flag pattern in an orderly downward channel formation. Support is at the bottom trendline of the channel near 8.5608. Below there, support is at the 61.8% Fibonacci retracement level from the previously mentioned timeframe (on the daily chart) near 8.523 and then horizontal support at 8.4209. However, notice that the RSI is diverging from price. This is an indication that USD/NOK may be ready to bounce to the top trendline of the channel, near 8.6409. If price fails to continue lower, horizontal resistance above is at the September 8th highs of 8.772. Additional horizontal resistance is at 8.7770.
Source: Tradingview, Stone X
With elections out of the way, USD/NOK seems to have reverted to its normal self, which is trading inversely to oil and a hawkish central bank. If oil continues to strengthen or if the Norges Bank indicates next week that they may hike again in the coming moths (ie remains hawkish), USD/NOK move to the double top target and flag target quite rapidly!
Learn more about forex trading opportunities.
Related tags:
Latest market news




Open an account in minutes
Experience award-winning platforms with fast and secure execution, and enjoy tight spreads from 0.5 pts on FX and 0.3 pts on indices.
Economic calendar
Web Trader platform
Our sophisticated web-based platform is packed with features.
Related articles
EUR/USD weekly outlook: FOMC and ECB to set the tone
The current backdrop is modestly bearish. On Friday, the EUR/USD closed modestly lower, down for the third consecutive day. The pair also posted a weekly decline after staging a modest recovery attempt in the previous week. Out of the past 8 weeks, the EUR/USD has fallen on 6 occasions. There is not much supporting factors for the single currency right now. So, the upside remains capped.

USD/JPY Forecast: Is Rising Japanese Inflation Supporting the Yen?
As the trading week comes to an end, one of the most relevant developments in the FX market has been the renewed strength of the Japanese yen. This can be seen in the recent performance of USD/JPY, which has fallen nearly 1.0% over the last two trading sessions, highlighting a meaningful recovery in the Japanese currency against the U.S. dollar.


Australian Dollar Forecast: AUD/USD Support Reversal Sparks Monthly Range Breakout 10 23 2026
A sharp reversal off key support has fueled the AUD/USD recovery, with resistance now in focus ahead of next week’s Fed decision and Australian CPI.

This report is intended for general circulation only. It should not be construed as a recommendation, or an offer (or solicitation of an offer) to buy or sell any financial products. The information provided does not take into account your specific investment objectives, financial situation or particular needs. Before you act on any recommendation that may be contained in this report, independent advice ought to be sought from a financial adviser regarding the suitability of the investment product, taking into account your specific investment objectives, financial situation or particular needs.
StoneX Financial Pte. Ltd., may distribute reports produced by its respective foreign entities or affiliates within the StoneX group of companies or third parties pursuant to an arrangement under Regulation 32C of the Financial Advisers Regulations. Where the report is distributed to a person in Singapore who is not an accredited investor, expert investor or an institutional investor (as defined in the Securities Futures Act), StoneX Financial Pte. Ltd. accepts legal responsibility to such persons for the contents of the report only to the extent required by law. Singapore recipients should contact StoneX Financial Pte. Ltd. at 6826 9988 for matters arising from, or in connection with the report.
In the case of all other recipients of this report, to the extent permitted by applicable laws and regulations neither StoneX Financial Pte. Ltd. nor its associated companies will be responsible or liable for any loss or damage incurred arising out of, or in connection with, any use of the information contained in this report and all such liability is hereby expressly disclaimed. No representation or warranty is made, express or implied, that the content of this report is complete or accurate.
StoneX Financial Pte. Ltd. is not under any obligation to update this report.
Trading CFDs carries a high level of risk that may not be suitable for some investors. Consider your investment objectives, level of experience, financial resources, risk appetite and other relevant circumstances carefully. The possibility exists that you could lose some or all of your investments, including your initial deposits. If in doubt, please seek independent expert advice. Visit www.forex.com/en-sg/terms-and-policies for the complete Risk Disclosure Statement.