



WTI Crude Oil Outlook: Technicals Could Realign With Bearish Positioning
Crude oil bears strengthen after COT data and bearish reversal, with WTI futures eyeing $60 and possibly upper $50s.
Share this:

Two weeks ago, I outlined a core bearish bias for crude oil prices while allowing for a potential short-term bounce. That bounce has now given way to a bearish reversal, offering bears a more favourable reward-to-risk setup. With positioning data and technical signals aligning, WTI futures may be on track for deeper losses towards $60 — or even the upper $50s if sentiment weakens further.
View related analysis:
View related analysis:
WTI Crude Oil Outlook: Positioning and Technical Signals Point to $60 Downside
WTI Crude Oil Positioning (CL): Weekly COT Report Analysis
Bearish bets against crude oil continued to rise last week according to the latest Commitment of Traders (COT) report. More specifically, managed funds are their least bullish on crude oil since 16 years at just 27.5k contracts. Large speculators are net long by 120k contracts, though their bullish ness is also trending lower.
In both cases, gross shorts are rising and gross longs are falling. While it could be suggested that net-long exposure to crude oil among managed funds is at a sentiment extreme, their gross-short exposure is not. And they’re clearly lightening their bullish load in anticipation of lower prices, so for now my bias remains to fade into rallies and for cured oil to fall to at least $60, or possible the upper $50s should sentiment allow.
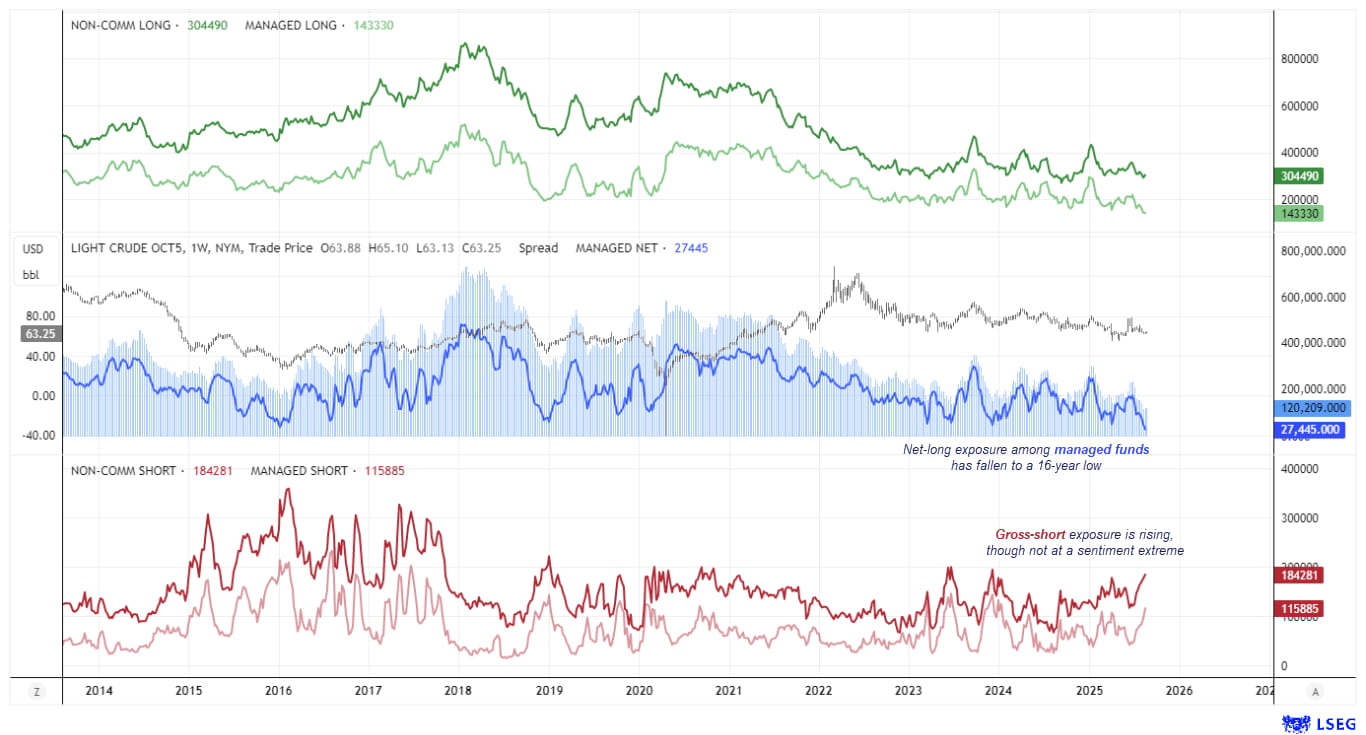
Chart analysis by Matt Simpson - data source: CME, LSEG
WTI Crude Oil Futures (CL) Technical Analysis – Daily Chart
The bounce in crude oil failed to reach the weekly VPOC (volume point of control) at 65.56, though it briefly tagged the $65 handle before bearish momentum took over. While not a textbook bearish engulfing candle, Tuesday’s session effectively acted like one — posting the most bearish range in over three weeks, with price closing near the day’s low.
Support has emerged at the 200-day SMA (63.23), raising the potential for a minor bounce within Tuesday’s range. However, the broader bias on the daily chart remains bearish while prices hold beneath Monday’s high (65.10). Bears now have the weekly VPOCs near $62.00 and $60.50 firmly in focus.
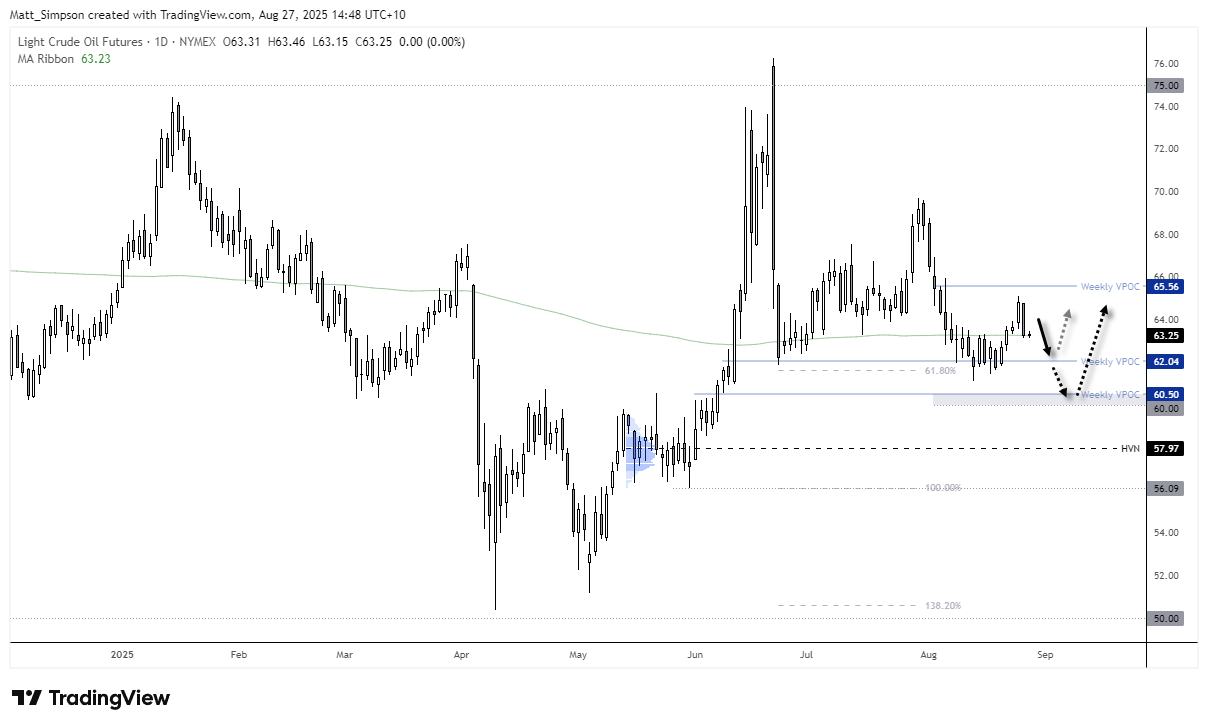
Chart analysis by Matt Simpson, Source: TradingView, ICE Futures, WTI Crude Oil
WTI Crude Oil Futures (CL) Technical Analysis – 1-Hour Chart
The 1-hour chart shows WTI crude oil attempting to build a base around $63.25, with the 200-day SMA, Thursday’s VPOC, and the weekly pivot clustered in the same zone alongside the $63 handle. A double bottom has also formed, accompanied by a 20-bar bullish reversal, hinting at scope for a minor bounce in the near term.
That said, bears may look for signs of a swing high beneath the $64.25 pinbar high as a signal to fade strength, with a break below $63 opening the way towards the $62.58 (Wednesday VPOC) and $62.04 (weekly VPOC) levels.

Chart analysis by Matt Simpson, Source: TradingView, ICE Futures, WTI Crude Oil
View the full economic calendar
View the full economic calendar
-- Written by Matt Simpson
Follow Matt on Twitter @cLeverEdge
How to trade with City Index
You can trade with City Index by following these four easy steps:
- Open an account, or log in if you’re already a customer
• Open an account in the UK
• Open an account in Australia
• Open an account in Singapore
- Search for the market you want to trade in our award-winning platform
- Choose your position and size, and your stop and limit levels
- Place the trade
Related tags:




Open an account in minutes
Experience award-winning platforms with fast and secure execution, and enjoy tight spreads from 0.5 pts on FX and 0.3 pts on indices.
Economic calendar
Web Trader platform
Our sophisticated web-based platform is packed with features.
Related articles

Crude Oil Forecast: Weekend Iran Strike Fears Lift Oil Toward War Highs
Brent crude oil is accelerating above $110 as traders price in the risk of a US-Israeli strike on Iran over the weekend. How much more of a geopolitical premium can oil build in before the close?


Nasdaq 100 Forecast: NDX Falls as the tech rout continues and oil prices soar
U.S. stocks are pointing to a modestly lower open after a sharp AI sell-off yesterday, as telecom stocks slide. Brent rises towards $115 adding to inflation pressures ahead of the FOMC rate decision.


Brent WTI Spread Hits 11-Year Wall and RSI Hits 2011 Highs
The Brent WTI spread is testing resistance that has held for about 11 years, with monthly RSI at overbought levels last seen in 2011.

This report is intended for general circulation only. It should not be construed as a recommendation, or an offer (or solicitation of an offer) to buy or sell any financial products. The information provided does not take into account your specific investment objectives, financial situation or particular needs. Before you act on any recommendation that may be contained in this report, independent advice ought to be sought from a financial adviser regarding the suitability of the investment product, taking into account your specific investment objectives, financial situation or particular needs.
StoneX Financial Pte. Ltd., may distribute reports produced by its respective foreign entities or affiliates within the StoneX group of companies or third parties pursuant to an arrangement under Regulation 32C of the Financial Advisers Regulations. Where the report is distributed to a person in Singapore who is not an accredited investor, expert investor or an institutional investor (as defined in the Securities Futures Act), StoneX Financial Pte. Ltd. accepts legal responsibility to such persons for the contents of the report only to the extent required by law. Singapore recipients should contact StoneX Financial Pte. Ltd. at 6826 9988 for matters arising from, or in connection with the report.
In the case of all other recipients of this report, to the extent permitted by applicable laws and regulations neither StoneX Financial Pte. Ltd. nor its associated companies will be responsible or liable for any loss or damage incurred arising out of, or in connection with, any use of the information contained in this report and all such liability is hereby expressly disclaimed. No representation or warranty is made, express or implied, that the content of this report is complete or accurate.
StoneX Financial Pte. Ltd. is not under any obligation to update this report.
Trading CFDs carries a high level of risk that may not be suitable for some investors. Consider your investment objectives, level of experience, financial resources, risk appetite and other relevant circumstances carefully. The possibility exists that you could lose some or all of your investments, including your initial deposits. If in doubt, please seek independent expert advice. Visit www.forex.com/en-sg/terms-and-policies for the complete Risk Disclosure Statement.