



WTI Goes for the $100 Break as Crude Oil Remains the Global Pressure Point
One of the main points of strategy from the U.S. has been that a closure of the Strait of Hormuz doesn’t impact the United States as much as other economies. But WTI has continued to show strength as supply disruptions carry ripple effects and US oil prices are trading above a massive level at the moment.
Share this:

WTI crude oil is going into the close of March with one of it’s largest monthly gains ever on a percentage basis and while the rationale seems rather obvious, the implication of such a move is really very widespread. And we likely haven’t even seen the first few ripple effects as that supply disruption has been addressed by an announcement of the release of the Strategic Petroleum Reserve which is set to begin next month.
While that announcement initially cooled some of the jitters from the heightened tensions around the Strait of Hormuz, it’s seemed to have a dwindling effect as the war has drug on and the impact has started to spread more and more to areas like US Treasuries and stocks, with equities finishing last week at the lows in a stunning late session sell-off.
It’s far from over, of course, on either side of the equation, as President Trump continues to inject hope that it all may soon be finished but the reality is as long as there’s mines in the Strait of Hormuz, or even the fear that there’s mines in the Strait, there’s going to be a very major factor for global macro markets to contend with as it goes right back to the source of equity strength for the past 18 years.
The Wealth Effect v/s the Inflation Mandate
Before the Global Financial Collapse it seemed that the Fed had a heightened priority over containing inflation, and that’s probably because the debacle of the 70’s with stagflation was on the front of mind for many central bankers. But seeing the way that risk-off engulfed global equity markets the Fed seemed to shift to more of a growth-oriented mindset, which was traditionally the job of Congress and fiscal policy. The justification, of course, was the other side of the Fed’s dual mandate with employment, but realistically there’s another concept that makes that make a bit more sense and that’s the wealth effect, a concept initially brought out in the 1950’s and at least part of the reason why the Federal Reserve still holds a multi trillion dollar portfolio of bond securities.
When markets are going up and consumers can see their wealth and retirement accounts growing they’re more likely to spend more money, which keeps growth going throughout the economy. Otherwise, hoarding behavior can build and the velocity of capital can slow, which is far less desirable for a central bank looking to push behavior with policy. This is, again, at least part of the reason to bias towards growth when inflation doesn’t seem worrisome and the choice is there. This is why the Fed continued to say that inflation was ‘transitory’ and supply chain related back in 2021 despite the fact that Covid stimulus and a reopened economy had everything roaring.
The major and significant risk to this is inflation, as that can force the Fed into a path away from rate cuts and, perhaps even rate hikes. And few factors have as much impact on inflation as higher oil prices.
The Derivative Effect of Higher Oil Prices
Petroleum isn’t just a precursor to gasoline as it’s in plastics and polyester and several other synthetic materials that we all take for granted. But beyond that, most products that we buy have to be transported and in many cases that requires gasoline. So not only are the materials in the products we purchase getting more expensive but getting those products to us, whether it’s through an internet purchase or something we buy at the store, costs much more as well.
So, sure, we’ll all be paying more at the pump and that’s an obvious initial impact. But everything else that we buy can increase in price, as well, given that very important impact of oil prices.
This is likely why US Treasuries have sold off so much in March on the back of this threat, as investors holding bonds with a locked in yield will see that yield erode on a real basis as inflation rates (or expectations for inflation rates) go higher. This can also impact stocks, such as we’ve seen, as higher inflation has a reverse impact on the wealth effect which then feeds into more prudence from consumers and lessened spending.
Perhaps more worrying is the uncontrollable nature of such arrangements and, on the part of Iran, it seems that uncertainty and impact via global markets is one of their main goals which they’re furthering through the pressure point of the Strait of Hormuz.
To this point, President Trump has openly stated that because the US produces so much oil and because the Strait is more of a vulnerability to other economies, this risk is diminished. But the reality is supply is supply and if we’re seeing supply constraints that can carry ripple effects in related markets, and that’s what we’re seeing in WTI right now.
WTI Crude Oil Weekly Chart
Chart prepared by James Stanley; data derived from Tradingview
WTI and $100
For the past four weeks WTI has quickly jumped above or opened above $100 each week and then retreated. This week started off the same but, so far, that level has come in as support which illustrates an increasing degree of acceptance at that price.
Where WTI above $100 a few weeks ago got sellers excited to fade the move, that same price level so far this week got bulls excited to jump in as a perceived value. This is dangerous as increasing acceptance above that price and demand continuing even at multi-week highs illustrates the potential for bullish breakout – which can carry a strong ripple effect through other markets.
WTI Crude Oil Daily Chart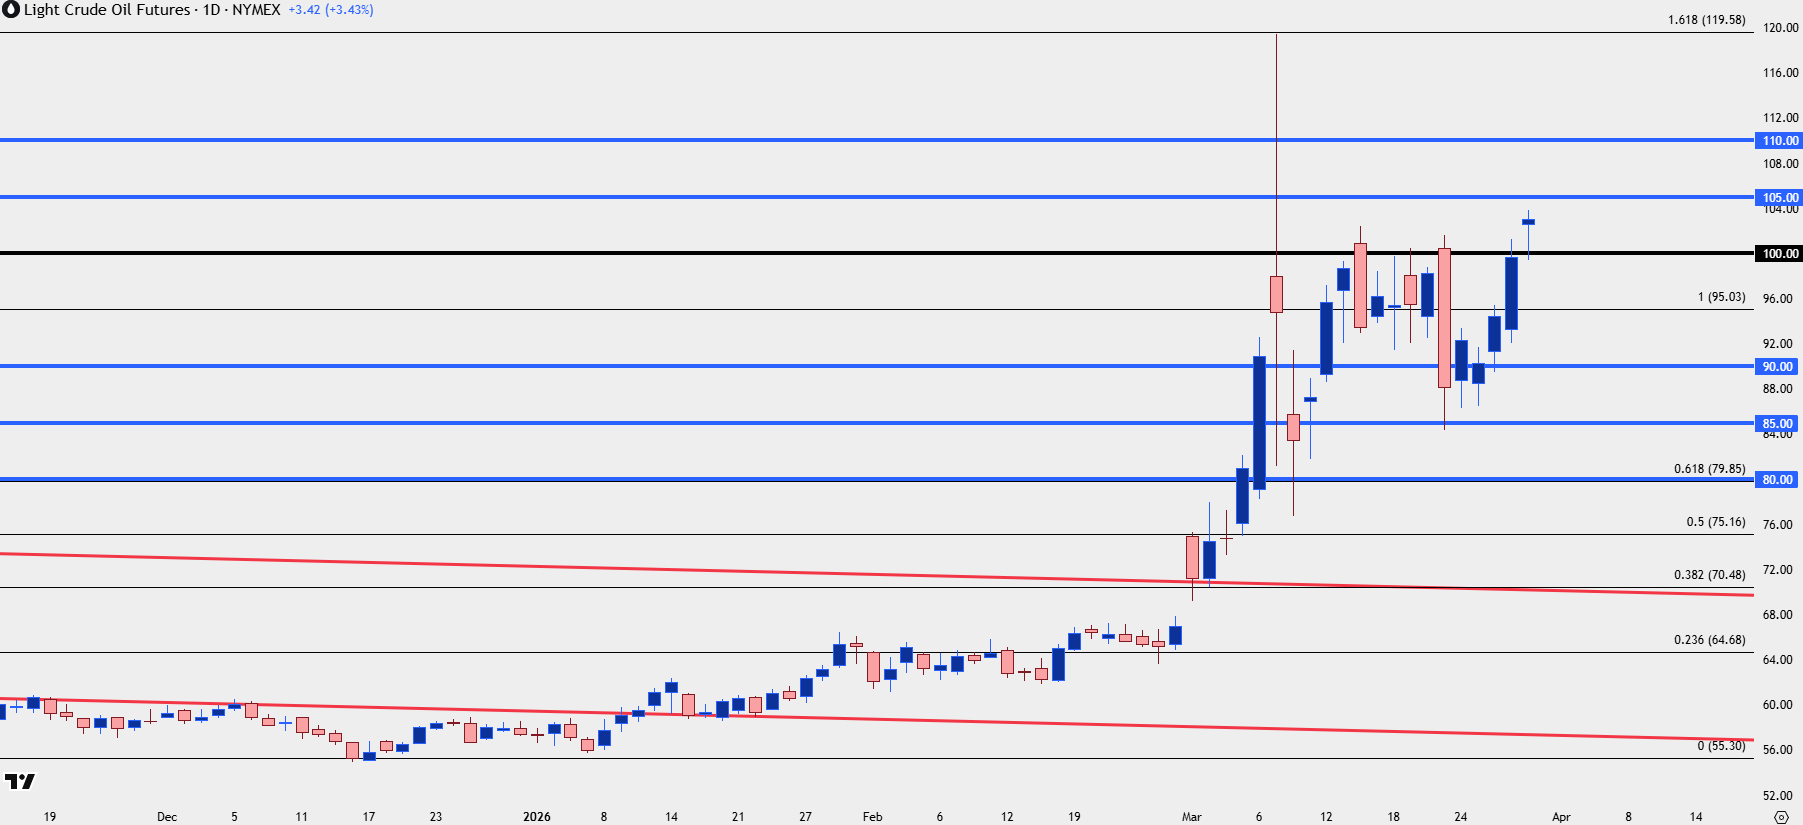
Chart prepared by James Stanley; data derived from Tradingview
WTI Shorter-Term
From the four-hour chart we can get a better picture of that topside breakout potential, and you can also see how these round whole numbers have come into play as support over the past three weeks as buyers have gotten increasingly more bullish.
A few weeks ago, $80 was that line in the sand, and then last week, $85 and then $90 came in as that ‘point of perceived value.’
The next levels up from that sequencing would be $105 and then $110, and the only factor that would seem to be able to turn this around would be a softening in tensions in the Middle East which seems a difficult factor to hope for at the moment.
Above that, the prior swing-high from early-March is all the way up around the $120 handle and that’s also a Fibonacci extension. If we see prices push above that we’re likely going to be looking at an intense risk-off scenario in equities, higher yields in bonds and a bullish breakout in the US Dollar.
WTI Crude Oil Four-Hour Chart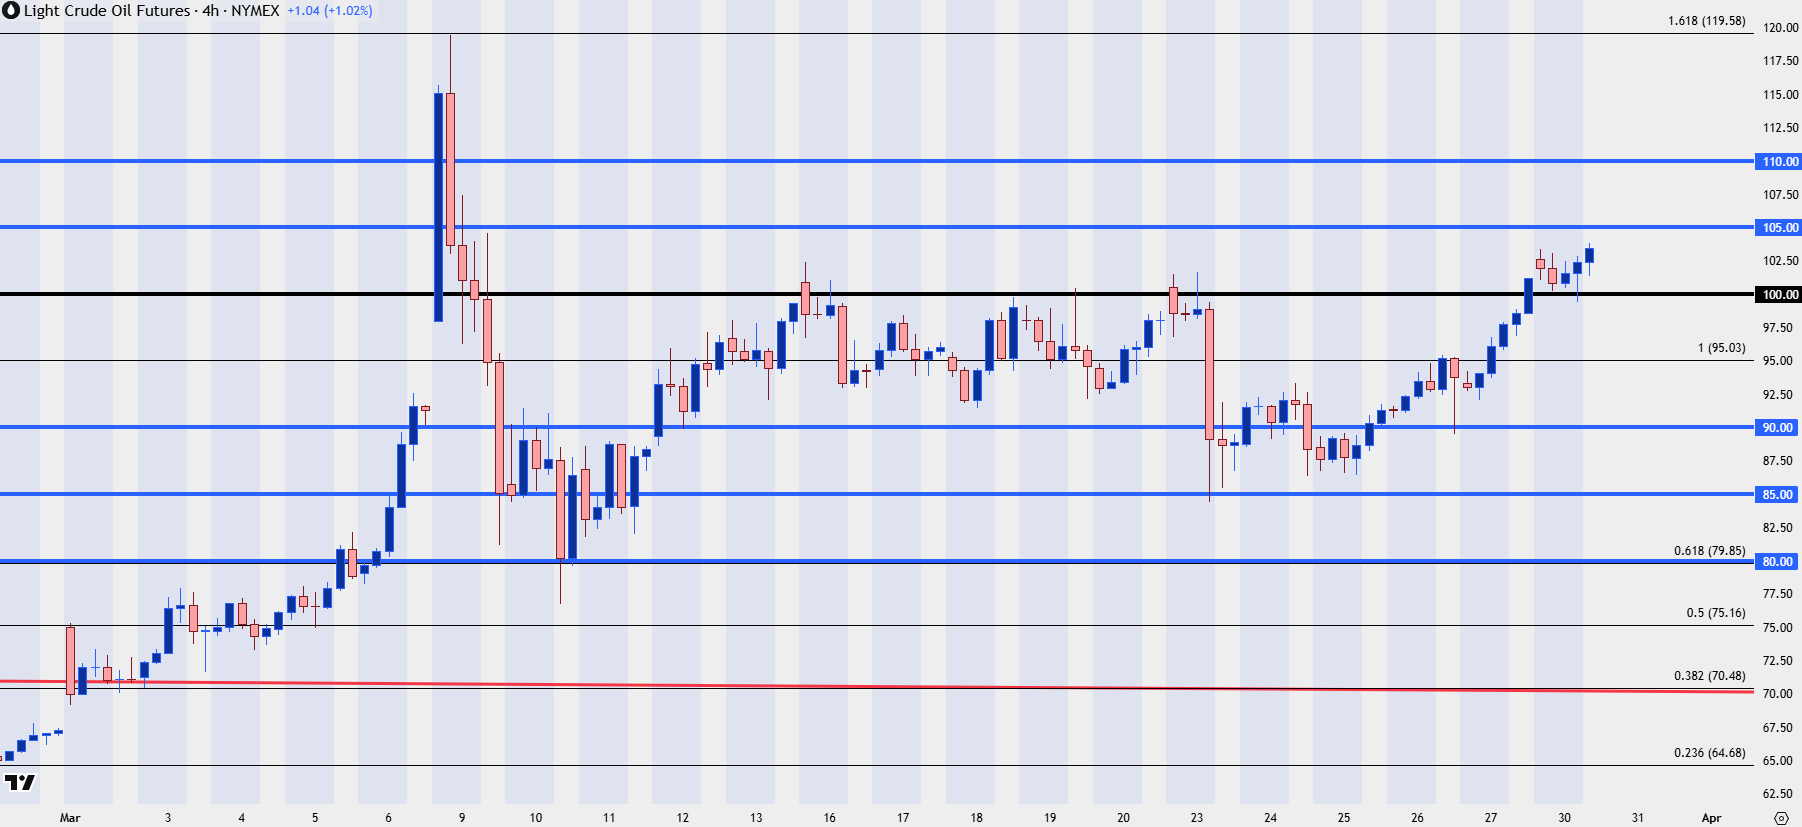
Chart prepared by James Stanley; data derived from Tradingview
--- written by James Stanley, Senior Market Analyst, Global Macro
Related tags:




Open an account in minutes
Experience award-winning platforms with fast and secure execution, and enjoy tight spreads from 0.5 pts on FX and 0.3 pts on indices.
Economic calendar
Web Trader platform
Our sophisticated web-based platform is packed with features.
Related articles

Nasdaq 100 Forecast: NDX slips as Treasury yields keep rising
U.S. stocks are falling at the start of Q4, as gains in software stocks offset concerns over soaring Treasury yields. U.S. Treasury yields continue to rise, with the 10-year yield up 2 basis points at 5.31% and the 30-year at 5.66%, multi-decade highs.


Gold Price Outlook: XAU/USD Resistance at $4200 Sets Up for NFP
It was a strong sell-off to start the week in gold and despite a Tuesday bounce, sellers are continuing to push following a resistance hit at the $4200 level.

Nasdaq Breakout Potential into Q4 for Melt Up Scenarios
The headlines seem negative in almost any place that you look, with surging Treasury yields and frothy AI valuations getting more and more attention. But, if it’s so bad, why hasn’t the Nasdaq melted down yet, even as the Fed has started hiking rates?
This report is intended for general circulation only. It should not be construed as a recommendation, or an offer (or solicitation of an offer) to buy or sell any financial products. The information provided does not take into account your specific investment objectives, financial situation or particular needs. Before you act on any recommendation that may be contained in this report, independent advice ought to be sought from a financial adviser regarding the suitability of the investment product, taking into account your specific investment objectives, financial situation or particular needs.
StoneX Financial Pte. Ltd., may distribute reports produced by its respective foreign entities or affiliates within the StoneX group of companies or third parties pursuant to an arrangement under Regulation 32C of the Financial Advisers Regulations. Where the report is distributed to a person in Singapore who is not an accredited investor, expert investor or an institutional investor (as defined in the Securities Futures Act), StoneX Financial Pte. Ltd. accepts legal responsibility to such persons for the contents of the report only to the extent required by law. Singapore recipients should contact StoneX Financial Pte. Ltd. at 6826 9988 for matters arising from, or in connection with the report.
In the case of all other recipients of this report, to the extent permitted by applicable laws and regulations neither StoneX Financial Pte. Ltd. nor its associated companies will be responsible or liable for any loss or damage incurred arising out of, or in connection with, any use of the information contained in this report and all such liability is hereby expressly disclaimed. No representation or warranty is made, express or implied, that the content of this report is complete or accurate.
StoneX Financial Pte. Ltd. is not under any obligation to update this report.
Trading CFDs carries a high level of risk that may not be suitable for some investors. Consider your investment objectives, level of experience, financial resources, risk appetite and other relevant circumstances carefully. The possibility exists that you could lose some or all of your investments, including your initial deposits. If in doubt, please seek independent expert advice. Visit www.forex.com/en-sg/terms-and-policies for the complete Risk Disclosure Statement.