







Yen Demand Subsides And Key Levels Hold
Whilst tensions can flare again at any moment, here are three yen pairs worth keeping an eye on from a technical standpoint.
Share this:

Tension in the Middle East have mostly dominated sentiment since Friday. However, the US session saw a mild rebound in risk and equities shrug off concerns with the lack of any further escalation. Going into the session it was noted several yen pairs were at key levels of support, which suggested it could be a pivotal moment for risk, even if shortly lived. Whilst tensions can flare again at any moment, here are three yen pairs worth keeping an eye on from a technical standpoint.
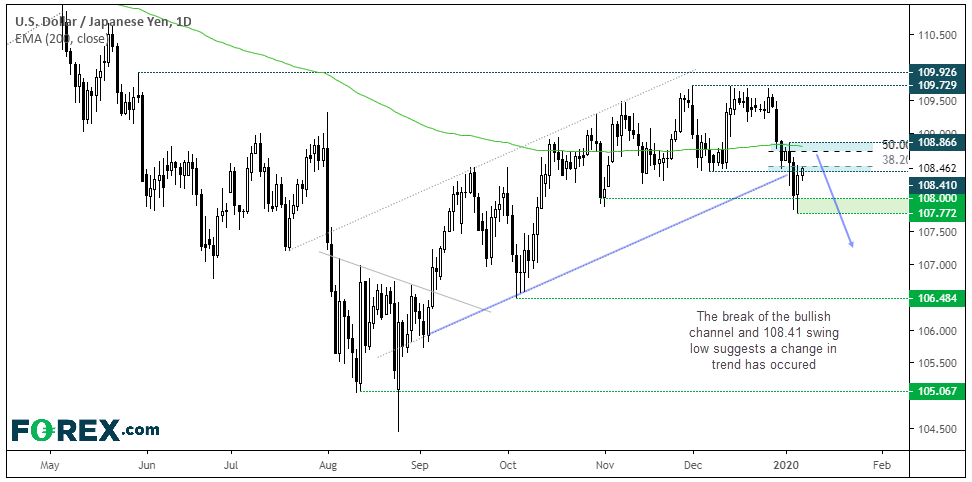
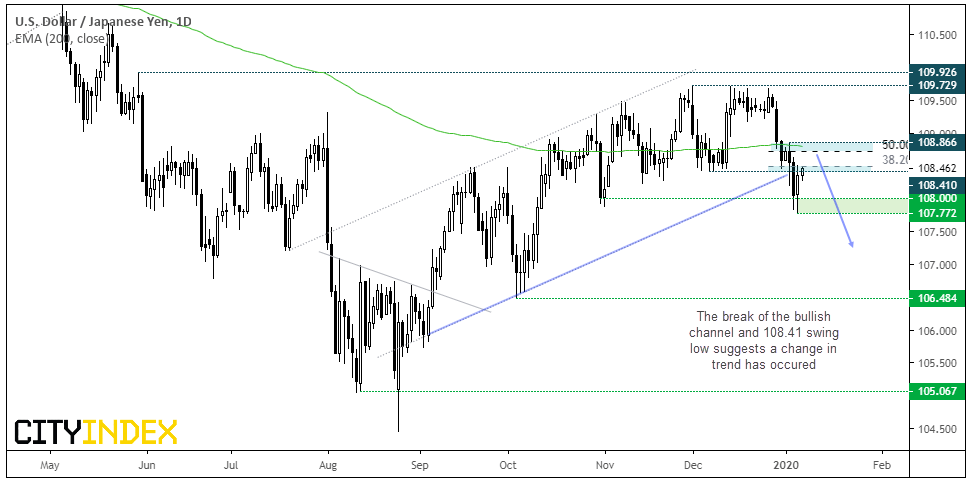
USD/JPY: It appears that USD/JPY has topped. Its failure to break above the 2nd December high sent a warning to the bull-camp before it rolled over late December. Whilst the initial sell-off remained within the bullish channel, the rise in tensions between US and Iran saw it break the bullish channel and 108.41 swing low, which warns of a change in trend.
- The core view remains bearish. However, price action is carving out a counter-trend move.
- Bears could look for evidence of a lower high beneath 109 and consider fading into the move and assume a break to new lows. The 38.2% and 50% retracement levels (and 200-day eMA) are areas for bears to monitor for signs of weakness.
- A break beneath the 107.77 low assumes bearish trend continuation.
- A break above 109 invalidates the core bearish view (although that’s not to say it can’t carve out a top later).
EUR/JPY: Firmer PMI data saw the Euro trade broadly higher yesterday, and EUR/USD breakout of an inverted H&S pattern on the hourly chart. Along with improved risk appetite, EUR/JPY also produced a bullish 2-bar reversal pattern on the daily.
A bullish channel remains in play and yesterday’s bullish piercing pattern suggests a swing low is in place. However, prices are now trading just below the 200-day eMA, a level we’d prefer to see broken before assuming a reversal is underway.
- Bulls could wait for a break above the 200-day eMA (121.50) to confirm the 2-bar reversal on the daily chart.
- The highs around 122.50-66 makes a viable target, a break above here brings 123.18-123.36 into focus.
- Whilst the 120.17 swing low and / or lower trendline can be used to aid risk management, 121.00 can also be considered for a tighter entry as it has been a pivotal level in recent weeks.
- A break below 120.00 assumes we’ve seen the end of a correction and the trend has reverted to its longer-term downtrend. A clue that this scenario could be playing out is if we fail to see prices re-test the highs around 122.50-66 and a lower high is formed.
AUD/JPY: Typically, we’d refer to AUD/JPY as the forex traders preferred barometer of risk. However, raging bush fires continue to wreak havoc across Australia at an unprecedented rate, which has seen lower growth forecasts at a time where it’s already a 50/50 as to whether RBA will cut rates. For this reason, AUD/JPY has not rebounded in the way it would have otherwise. This leaves it on a knives edge as to whether we’ll see a rebound, or whether it will keel over in due course.
A strong rebound would require general risk on (and tensions from Middle East recede) alongside bush fires coming under control. A strong signal for bears is to see fires rage on and Middle East tensions escalate further.
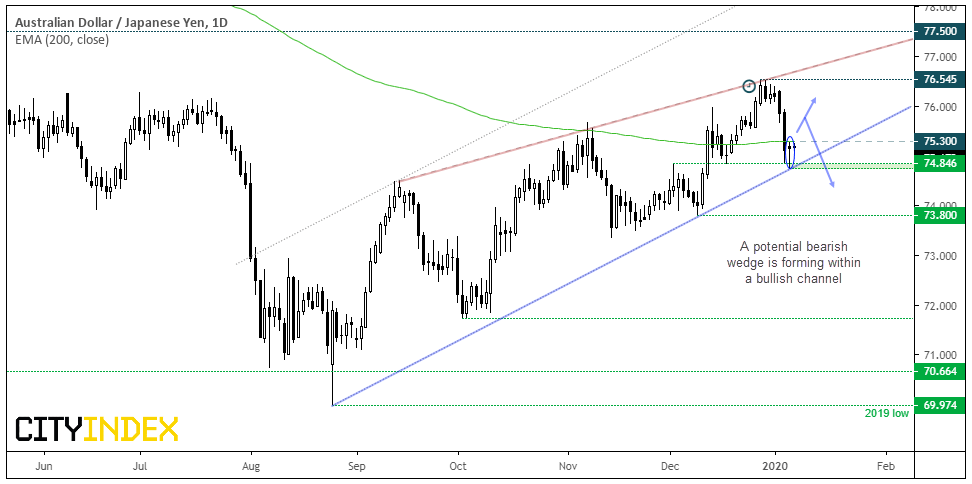
- A small bullish hammer has formed and respected the lower trendline of a bullish channel. However, the 200-day eMA is capping as resistance. Moreover, a potential bearish wedge is also forming which, if successful, targets the lows around 70.0.
- A break above 75.30 confirms the bullish hammer reversal and near-term bullish bias. However, given the potential bearish wedge, we’d also monitor the potential for a lower high to form beneath 76.55 to warn that the bearish wedge is still under consideration.
- Direct gains above 75.30 makes the bearish wedge less likely.
- A break beneath 74.85 confirms the bearish wedge is in play.
Related Analysis:
USD/JPY Holds Support Despite Rise In Geopolitical Tensions
Market Brief: Traders Calm Their Middle East Fears
Tension in the Middle East have mostly dominated sentiment since Friday. However, the US session saw a mild rebound in risk and equities shrug off concerns with the lack of any further escalation. Going into the session it was noted several yen pairs were at key levels of support, which suggested it could be a pivotal moment for risk, even if shortly lived. Whilst tensions can flare again at any moment, here are three yen pairs worth keeping an eye on from a technical standpoint.
USD/JPY: It appears that USD/JPY has topped. Its failure to break above the 2nd December high sent a warning to the bull-camp before it rolled over late December. Whilst the initial sell-off remained within the bullish channel, the rise in tensions between US and Iran saw it break the bullish channel and 108.41 swing low, which warns of a change in trend.
- The core view remains bearish. However, price action is carving out a counter-trend move.
- Bears could look for evidence of a lower high beneath 109 and consider fading into the move and assume a break to new lows. The 38.2% and 50% retracement levels (and 200-day eMA) are areas for bears to monitor for signs of weakness.
- A break beneath the 107.77 low assumes bearish trend continuation.
- A break above 109 invalidates the core bearish view (although that’s not to say it can’t carve out a top later).
EUR/JPY: Firmer PMI data saw the Euro trade broadly higher yesterday, and EUR/USD breakout of an inverted H&S pattern on the hourly chart. Along with improved risk appetite, EUR/JPY also produced a bullish 2-bar reversal pattern on the daily.
A bullish channel remains in play and yesterday’s bullish piercing pattern suggests a swing low is in place. However, prices are now trading just below the 200-day eMA, a level we’d prefer to see broken before assuming a reversal is underway.
- Bulls could wait for a break above the 200-day eMA (121.50) to confirm the 2-bar reversal on the daily chart.
- The highs around 122.50-66 makes a viable target, a break above here brings 123.18-123.36 into focus.
- Whilst the 120.17 swing low and / or lower trendline can be used to aid risk management, 121.00 can also be considered for a tighter entry as it has been a pivotal level in recent weeks.
- A break below 120.00 assumes we’ve seen the end of a correction and the trend has reverted to its longer-term downtrend. A clue that this scenario could be playing out is if we fail to see prices re-test the highs around 122.50-66 and a lower high is formed.
AUD/JPY: Typically, we’d refer to AUD/JPY as the forex traders preferred barometer of risk. However, raging bush fires continue to wreak havoc across Australia at an unprecedented rate, which has seen lower growth forecasts at a time where it’s already a 50/50 as to whether RBA will cut rates. For this reason, AUD/JPY has not rebounded in the way it would have otherwise. This leaves it on a knives edge as to whether we’ll see a rebound, or whether it will keel over in due course.
A strong rebound would require general risk on (and tensions from Middle East recede) alongside bush fires coming under control. A strong signal for bears is to see fires rage on and Middle East tensions escalate further.
- A small bullish hammer has formed and respected the lower trendline of a bullish channel. However, the 200-day eMA is capping as resistance. Moreover, a potential bearish wedge is also forming which, if successful, targets the lows around 70.0.
- A break above 75.30 confirms the bullish hammer reversal and near-term bullish bias. However, given the potential bearish wedge, we’d also monitor the potential for a lower high to form beneath 76.55 to warn that the bearish wedge is still under consideration.
- Direct gains above 75.30 makes the bearish wedge less likely.
- A break beneath 74.85 confirms the bearish wedge is in play.
Related Analysis:
USD/JPY Holds Support Despite Rise In Geopolitical Tensions
Market Brief: Traders Calm Their Middle East Fears



Open an account in minutes
Experience award-winning platforms with fast and secure execution, and enjoy tight spreads from 0.5 pts on FX and 0.3 pts on indices.
Economic calendar
Web Trader platform
Our sophisticated web-based platform is packed with features.
Related articles

US Dollar Technical Outlook: DXY Bulls Meet Resistance at Yearly Highs 10 1 2026
The U.S. Dollar has held firm despite fading Fed hike bets, but Friday’s payrolls could test the rally’s staying power.


Tankan Backs BOJ Tightening, but Yen Rate Expectations Ease
Japan’s Tankan supports further BOJ tightening, although softer rate expectations could limit support for the Japanese yen.


AUD/USD hammered by US yields and fading RBA hike bets
US yields, dollar strength and fading RBA hike bets have combined to drive AUD/USD to fresh multi-month lows. The macro and technical bias remains bearish, although history suggests parts of the move are now reaching unusually stretched levels.

This report is intended for general circulation only. It should not be construed as a recommendation, or an offer (or solicitation of an offer) to buy or sell any financial products. The information provided does not take into account your specific investment objectives, financial situation or particular needs. Before you act on any recommendation that may be contained in this report, independent advice ought to be sought from a financial adviser regarding the suitability of the investment product, taking into account your specific investment objectives, financial situation or particular needs.
StoneX Financial Pte. Ltd., may distribute reports produced by its respective foreign entities or affiliates within the StoneX group of companies or third parties pursuant to an arrangement under Regulation 32C of the Financial Advisers Regulations. Where the report is distributed to a person in Singapore who is not an accredited investor, expert investor or an institutional investor (as defined in the Securities Futures Act), StoneX Financial Pte. Ltd. accepts legal responsibility to such persons for the contents of the report only to the extent required by law. Singapore recipients should contact StoneX Financial Pte. Ltd. at 6826 9988 for matters arising from, or in connection with the report.
In the case of all other recipients of this report, to the extent permitted by applicable laws and regulations neither StoneX Financial Pte. Ltd. nor its associated companies will be responsible or liable for any loss or damage incurred arising out of, or in connection with, any use of the information contained in this report and all such liability is hereby expressly disclaimed. No representation or warranty is made, express or implied, that the content of this report is complete or accurate.
StoneX Financial Pte. Ltd. is not under any obligation to update this report.
Trading CFDs carries a high level of risk that may not be suitable for some investors. Consider your investment objectives, level of experience, financial resources, risk appetite and other relevant circumstances carefully. The possibility exists that you could lose some or all of your investments, including your initial deposits. If in doubt, please seek independent expert advice. Visit www.forex.com/en-sg/terms-and-policies for the complete Risk Disclosure Statement.