December seasonality is beginning to turn more supportive for the Australian dollar, raising the prospect of a late-year Santa rally in AUD/USD. However, with the pair stalling below key resistance and several traditional correlations breaking down, the setup remains finely balanced heading into year-end.
View related analysis:
- S&P 500 Seasonality: How Santa's Rally Across Wall Street Stacks Up
- ASX 200 Market Outlook: Santa’s Rally Arrives Early for Materials
- US Dollar Seasonality in December: USD/JPY, USD/CHF, EUR/USD, AUD/USD
- ASX 200 Market Outlook: Can Santa’s Rally Help the ASX This December?
AUD/USD Seasonality and Monthly Chart Risks
AUD/USD has risen 0.95% so far this month at the time of writing. That puts it broadly in line with an average December for the Aussie based on seasonality. Over the past 25 years, AUD/USD has averaged a December gain of 0.79%. However, the median return is effectively flat at 0.08%, highlighting how choppy and unreliable December outcomes tend to be.
That said, positive Decembers over the past 25 years have averaged gains of around 3.1%, which—if repeated—could see AUD/USD break above 67c. Realistically, that looks unlikely at this late stage of the month.
We should also consider the risk of a bearish monthly pattern forming by month-end. Currently trading around 0.6613, a monthly close near or below 65c would produce a textbook shooting star on the monthly chart. The fact that such a candle would form after a failure near 67c would also imply a double top around the year’s high, reinforcing a bearish technical setup heading into the new year. It is also worth noting that January tends to deliver negative returns on both an average and median basis.

Chart prepared by Matt Simpson - Source: LSEG

AUD/USD December Seasonality: Santa Rally Window Approaches
Here is your police reminder that it is around this time in December that Santa’s rally tends to kick in, if it does at all. Daily average returns have had a tendency to increase from around December 20, with the majority of days being accompanied by a win rate above 50%. With the Aussie having already retraced lower from its high, perhaps odds do favour a rally – at leas6t over the near term.
With that all said, seasonality patterns really are just an average of historical returns. This means they are an observation of the past and not necessarily a predictor of the future. Macro events can easily overpower seaosnali6ty patterns, and they are merely a tool to use alongside other forms of analysis.

Chart prepared by Matt Simpson - Source: LSEG
AUD/USD Correlations
Several of the Australian dollar’s classic correlations have weakened over the past two weeks, most notably against the US dollar and the Chinese yuan.
- The 10-day correlation with DXY has slipped to around -0.5, pointing to only a weak inverse relationship at best, while the 20-day correlation is effectively flat near -0.1.
- The usually positive relationship with the yuan has also flipped sharply, with the 10-day correlation falling to around -0.9, highlighting a meaningful breakdown in that linkage.
- That said, the Australian dollar has retained a positive correlation with equity markets, including the ASX 200 and S&P 500, although both sit slightly below the preferred 0.8 threshold for a strong relationship.
- If these correlations hold, AUD/USD could still grind higher into year-end provided Wall Street and the ASX 200 finish the year on a positive footing.
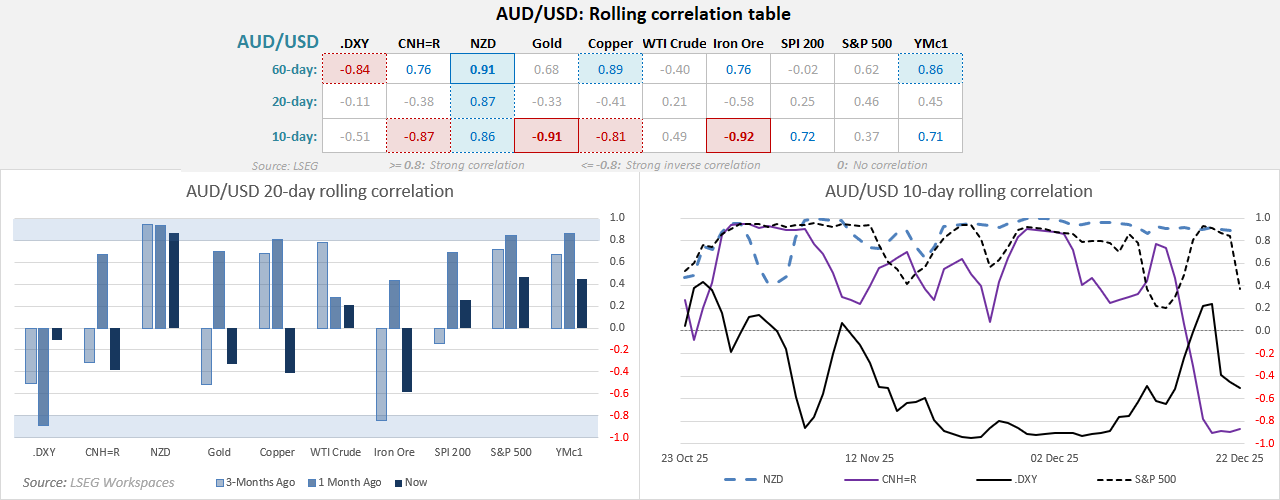
Chart prepared by Matt Simpson - Source: LSEG

AUD/USD Technical Analysis: Australian Dollar vs US Dollar
A bearish engulfing candle formed last week, although it did not close low enough to classify the past three weeks as a completed evening star pattern. Even so, this keeps the door open for a retracement toward the 10-week EMA and the November high around 0.6580. However, with seasonality potentially turning supportive after a pullback has already occurred, dips are preferred this week in line with a near-term bullish bias.
On the daily chart, the RSI (2) reached oversold territory on Wednesday, ahead of Thursday’s bullish doji and Friday’s inside day holding above the 20-day EMA. This setup suggests scope for another push higher, with a retest of the weekly VPOC near 0.6670 in focus. The 67c handle and the 2025 high remain viable upside targets if risk appetite improves further.

Chart analysis by Matt Simpson - data source: TradingView AUD/USD
View the full economic calendar
-- Written by Matt Simpson
Follow Matt on Twitter @cLeverEdge