
One of the most relevant events for emerging markets in recent sessions has been the outcome of Brazil’s presidential election. Following Lula da Silva’s victory in the second round, investor sentiment began to deteriorate noticeably. This can be observed in both the iShares MSCI Brazil ETF and the VanEck Brazil Small-Cap ETF, two important benchmarks for tracking the Brazilian equity market, both of which have posted declines of more than 15% at the start of the week.
For now, this reaction appears to be driven primarily by growing political and fiscal uncertainty. The election result has led investors to reassess risks related to public spending, fiscal discipline and debt dynamics over the coming years, a situation that could continue weighing on Brazilian financial assets in the near term.

An Election Surprise
Since the first round of voting on October 4, Brazil’s election process had become an important focal point for financial markets. At that stage, Flavio Bolsonaro, representing the political right, surprised markets by securing nearly 47% of the vote compared with approximately 45% for Lula da Silva. The result materially altered market expectations and increased confidence in a potential Bolsonaro victory in the runoff election.
Following the first-round result, Brazilian equities recovered consistently as investors began to reduce part of the fiscal risk premium embedded in local assets. The market also started to price in a potentially more favorable fiscal discipline scenario and a lower degree of government intervention in the economy.
However, the biggest surprise came during the second round. Lula successfully reversed the disadvantage seen weeks earlier and ultimately won the election with 51.8% of the vote versus 48.2% for Bolsonaro. What makes this result particularly relevant is that it significantly changed the narrative that had been developing after the first round and caught a large portion of the market off guard.
This matters because the immediate reaction was a rise in uncertainty and an increase in the risk premium demanded by investors to hold Brazilian assets. Markets have once again shifted their attention toward concerns related to higher public spending, fiscal deficits and debt growth, factors that have historically generated caution among investors.
The impact was quickly reflected in the fixed-income market. Brazilian 10-year government bond yields, which had been moderating toward the 13% area before the election, surged sharply to nearly 15.45%. This movement suggests that investors are demanding a higher return to maintain exposure to Brazilian assets, reflecting a rising perception of sovereign risk and a deterioration in confidence immediately following the election result.
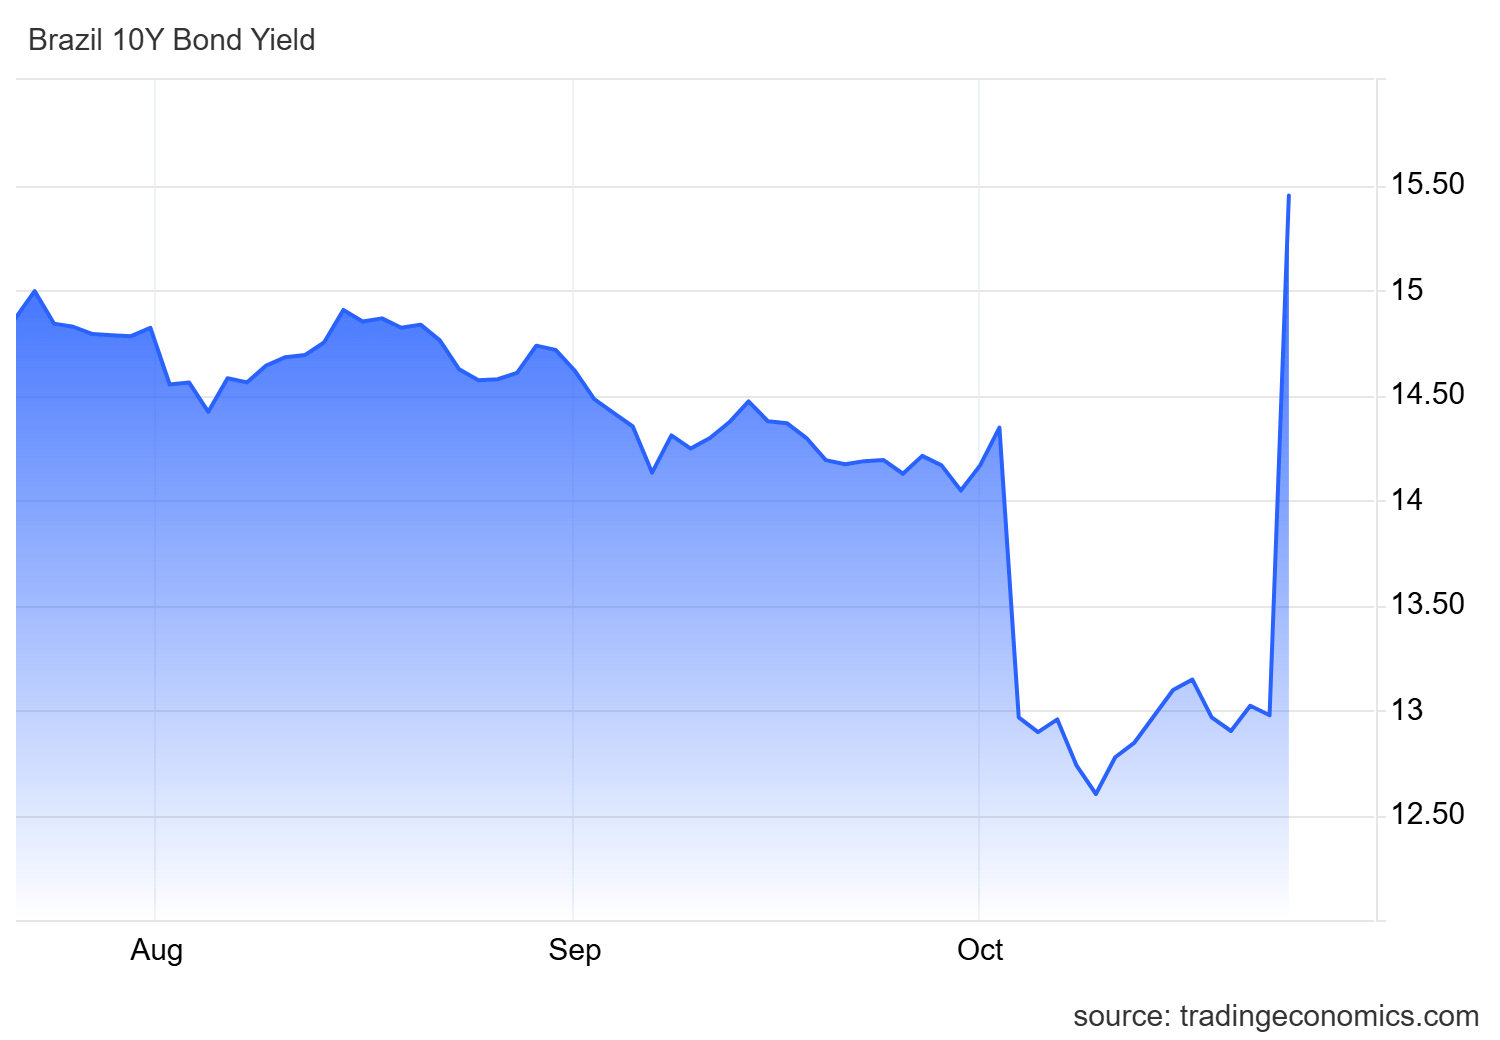
Source: TradingEconomics
The reaction was not limited to the bond market. The decline in investor confidence quickly spread to equities as well. Major companies such as Petrobras recorded declines close to 14%, while Santander Brasil fell approximately 13% during the session.
This development is important because it highlights how the election result has affected multiple segments of Brazil’s financial markets. It is within this context that the VanEck Brazil Small-Cap ETF and the iShares MSCI Brazil ETF become particularly relevant, since both vehicles provide broad exposure to Brazilian equities.
The selling pressure observed in these ETFs reflects a significant reduction in investor confidence regarding the short-term stability of the Brazilian stock market. At the same time, the rise in bond yields may increase the relative attractiveness of fixed-income investments compared to equities, potentially encouraging additional capital outflows from certain equity segments.
As long as concerns surrounding fiscal risk remain elevated and bond yields continue to trade at high levels, selling pressure across Brazil’s equity market could remain an important theme in the sessions ahead.
Technical Forecast for the iShares MSCI Brazil ETF
Source: StoneX Tradingview
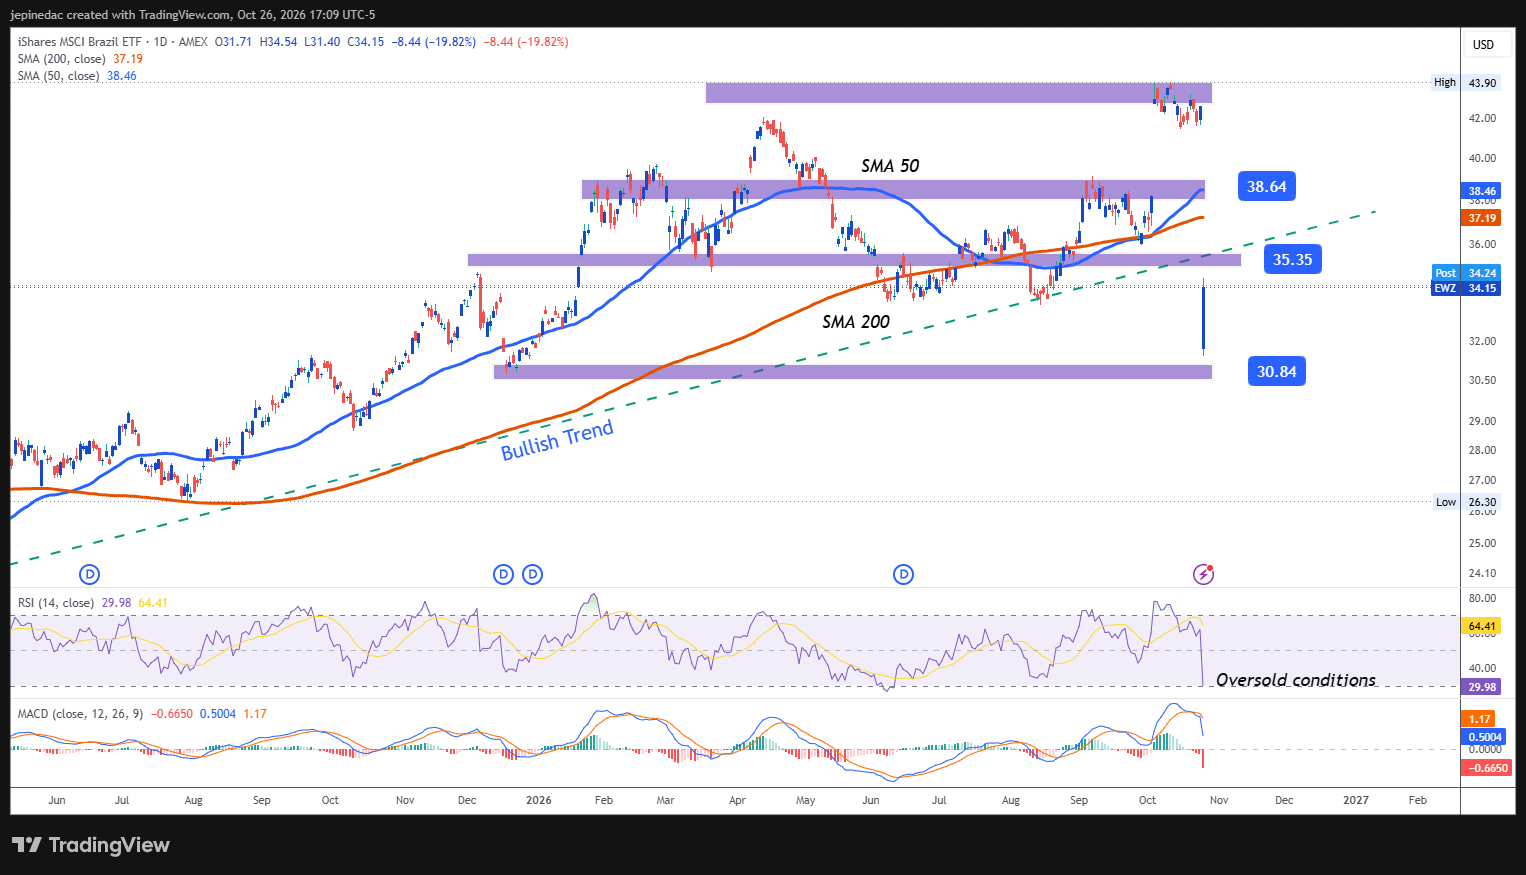
- The previous bullish trend is beginning to lose relevance: Since the first months of 2025, the ETF had managed to sustain an important bullish trendline that remained the dominant technical structure on the chart. However, following the election result, the decline in investor confidence triggered a sharp drop toward the $34 area, a move that has started to place the trendline that supported price action over recent months under significant pressure. For now, selling pressure is not yet strong enough to confirm the beginning of a structured bearish trend. However, it has been sufficient to alter the broader market structure and introduce a phase of uncertainty that could eventually favor the development of a more consistent consolidation range if confidence fails to recover in the coming sessions.
- RSI: The RSI has moved below the 50 neutral level, indicating that selling momentum has become dominant in recent trading sessions. However, it is also important to note that the decline has been so aggressive that the indicator is now approaching the 30 oversold zone, a development that could signal excessive recent selling pressure and potentially open the door to short-term bullish corrections.
- MACD: The MACD histogram continues to develop well below the 0 neutral line, suggesting that short-term moving averages are maintaining a consistent bearish structure. As long as this behavior remains in place, it could continue supporting a dominant bearish bias in the sessions ahead.
Key Levels:
- 38.64 – Key Resistance: A level that coincides with highs observed several weeks ago and currently aligns with the 50-period simple moving average. A move back toward this area could reduce the recent selling pressure and restore relevance to the previous bullish trendline as the dominant structure on the chart.
- 35.35 – Near-Term Barrier: A level that aligns with an important retracement zone observed in recent weeks and currently represents one of the main equilibrium areas on the chart. It could become the key reference level to watch in the event of short-term bullish corrections.
- 30.84 – Key Support: An area not seen since December 2025 that currently represents the most important downside barrier on the chart. A sustained move below this level could signal a significant structural change and favor the development of a more consistent bearish trend over the coming weeks.
Written by Julian Pineda, CFA, CMT – Market Analyst
Follow him on: @julianpineda25