
Gold Technical Outlook: XAU/USD Multi-Timeframe Analysis
Gold price support is under test after a 12.6% slide from the August high, as rising Treasury yields add fresh pressure on the precious metal. Michael Boutros, StoneX Media Senior Market Analyst, walks through gold's weekly, daily and four-hour charts and the opening ranges that frame its next breakout. Gold's key support sits where the 78.6% Fibonacci retracement of the advance off the yearly low meets a trendline in place since 2024. The weekly opening range above that zone sets the breakout trigger, while climbing Treasury yields and upcoming Federal Reserve minutes shape the macro backdrop.
This content was created by an affiliate of FOREX.com and represents the views and opinions of the author/speakers, not the views and opinions of Forex.com, StoneX Group Inc., or its subsidiaries. The content has not been independently reviewed by FOREX.com.

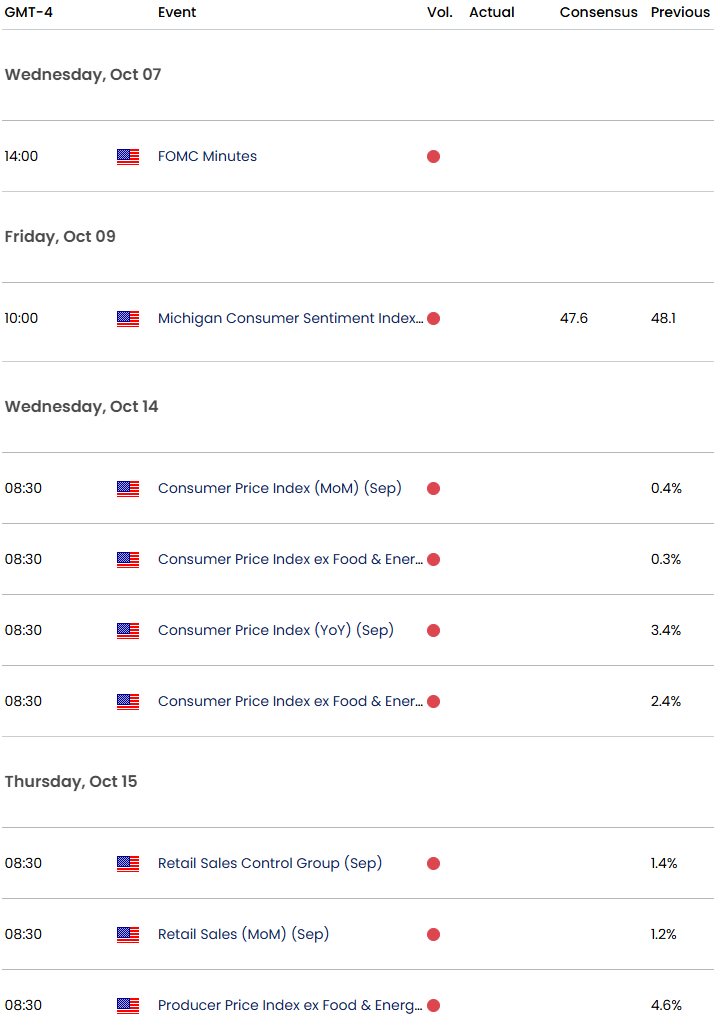
Key US Economic Data Releases
Active Short-term Technical Video Updates
- Swiss Franc Technical Outlook: USD/CHF Bulls Attempt to Regroup After Sharp Reversal
- US Dollar Technical Outlook: DXY Bulls Meet Resistance at Yearly Highs
- British Pound Technical Outlook: GBP/USD Rebound Challenges September Downtrend
- Canadian Dollar Technical Outlook: USD/CAD Seven-Day Rally Tests Major Resistance
- Australian Dollar Technical Outlook: AUD/USD Breakdown Threatens Deeper Correction
--- Written by Michael Boutros, Senior Technical Strategist
Follow Michael on X @MBForex