
Japanese Yen Technical Forecast: USD/JPY Weekly Trade Levels
- USD/JPY surges more than 1.1% into weekly open- rally halts at range-resistance
- USD/JPY breakout imminent in the days ahead- limited event risk on tap (FOMC minutes)
- Resistance 146.15 (key), ~148.65/95, 150.88- Support 143.68, 139.58-140.49 (key), 136.51
The Japanese Yen is under assault early in the week with USD/JPY surging into resistance at the top of a multi-week range in price. We are on breakout watch early in the month and the battle lines are drawn on the USD/JPY weekly technical chart.
Review my latest Weekly Strategy Webinar for an in-depth breakdown of this Yen setup and more. Join live on Monday’s at 8:30am EST.
Japanese Yen Price Chart – USD/JPY Weekly

Chart Prepared by Michael Boutros, Sr. Technical Strategist; USD/JPY on TradingView
Technical Outlook: In last month’s Japanese Yen Technical Forecast we noted that USD/JPY was, “trading just above multi-year uptrend support with a tight-range in view early in the month. From a trading standpoint, the immediate focus is on a breakout of the 143.68-146.15 range for guidance here with the yearly downtrend vulnerable while above the 2021 trendline. Look for the breakout in the days ahead.” The breakout never came- USD/JPY attempted to breach in the following weeks but was unable to mark a close above range resistance (close high registered at 146.09). The range is preserved heading into the start of July with the bulls testing resistance early in the week- watch the close here.
A topside breach exposes 148.65/96- a region defined by the December low, the May high, and the 52-week moving average. Subsequent resistance eyed at the 100% extension of the April advance at 150.88 with a breach / close above the 61.8% retracement of the yearly range / 2022 & 2023 highs at 151.62/95 needed to mark resumption of the broader multi-year uptrend in USD/JPY.
A break / weekly close below the yearly low-week close (LWC) at 143.68 would invalidate the 2021 uptrend and threaten another bout of accelerated losses. Key support (multi-year bullish invalidation) rests at the yearly lows near 139.58-140.49- a region defined by the December 2023 & 2024 lows and the 61.8% retracement of the 2023 advance. Look for a larger reaction there IF reached with a close below needed to mark resumption of the 2024 downtrend. The first major technical consideration rests with the 100% extension at 136.51 in the event of a breakdown.

Bottom line: USD/JPY is testing multi-month range resistance early in the week. From a trading standpoint, a good zone to reduce portions of long-exposure / raise protective stops – losses would need to be limited to the monthly open at 144.07 IF price is heading higher on this stretch with a close above 146.15 needed to fuel the next leg higher.
The economic calendar is light this week so look for broader market sentiment to drive here with a steady drip of tariff news early in the session continuing to fuel some volatility. Watch the weekly closes. I’ll publish an updated Japanese Yen Short-term Outlook later this week, once we get further clarity on the near-term USD/JPY technical trade levels.
USD/JPY Key Economic Data Releases
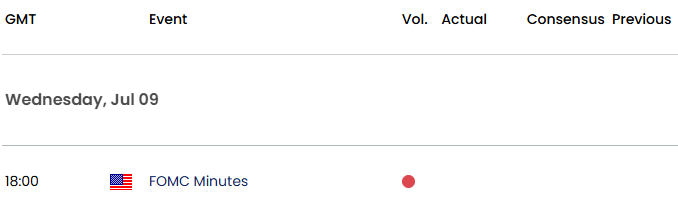
Economic Calendar - latest economic developments and upcoming event risk.
Active Weekly Technical Charts
- Euro (EUR/USD)
- Gold (XAU/USD)
- Australian Dollar (AUD/USD)
- British Pound (GBP/USD)
- Canadian Dollar (USD/CAD)
- US Dollar Index (DXY)
- Swiss Franc (USD/CHF)
- Crude Oil (WTI)
--- Written by Michael Boutros, Sr Technical Strategist
Follow Michael on X @MBForex