


S&P 500 Grasps At Support as Surging Hike Odds, Treasury Yields Threaten Larger Turn
Stocks continue to turn in Q4 and the post-earnings bounce from NVDA has been faded, while the S&P 500 grasps on to a support level with a large amount of open space below.
Share this:

S&P 500 Talking Points:
- Coming into Q4 I was quite bearish in the equity forecasts, saying “I think there’s the possibility that we see a sell-off that’s more than just a pullback.” At this point, the Nasdaq 100 is already in correction territory after falling more than 10% from the all-time-high set just a couple weeks after that forecast was published.
- The AI trade has obviously been a big part of these developments but so too has the continued rise in Treasury Yields and a persistently hawkish Fed, which threaten to extend sell-offs in the equity space.
Oversold conditions make for difficult backdrops of continuation. And that’s what showed up the week before last, just a few weeks after stocks had set fresh all-time-highs. It was a perfect storm of pain as funding worries in the AI space were met with surging Treasury Yields and a hawkish Fed, and suddenly, there was a major liquidity concern across macro markets.
This was a centerpiece of the Q4 equity forecasts, which I titled ‘Cracks Begin to Show,’ and since then those cracks have developed into craters and we may not yet be at the end of that road. Both the Nasdaq and S&P (as well as NVDIA) set fresh all-time-highs in the early days of Q4, just after that forecast was published. But since then the backdrop has shifted dramatically to lead us in to our current situation.
Nasdaq 100 Weekly Chart: A Noticeable Q4 Shift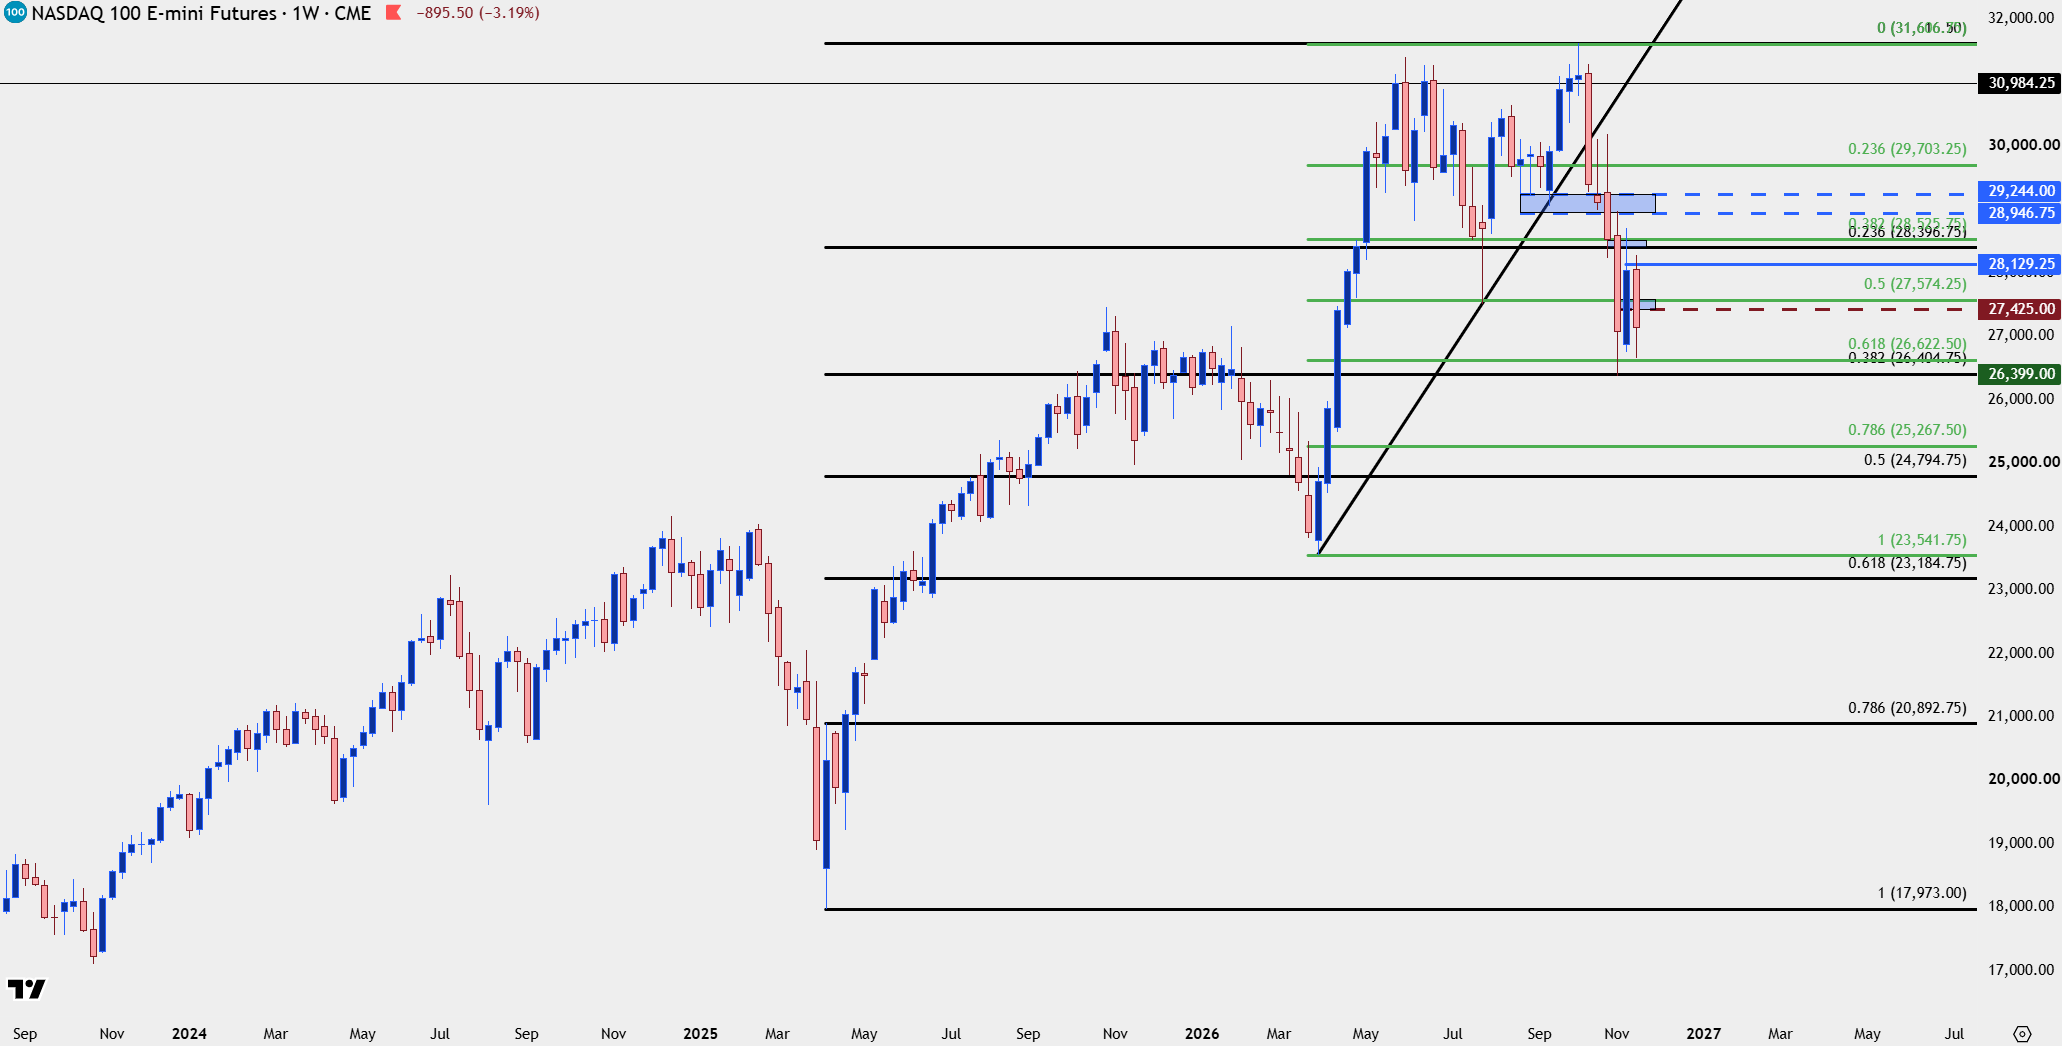
Chart prepared by James Stanley; data derived from Tradingview
How It’s All Developed
The rate hike from the Fed in September took few by surprise as the bank had telegraphed the move for months. The forecast for another hike, however, was probably a bit more surprising to some although markets quickly firmed up expectations for another 25 bp move in December.
And despite that, equities continued to rally through the end of Q3 and the opening days of Q4.
What has shifted, however, has been sentiment around the AI trade, and this is something I’ve tracked closely in videos on StoneX TV. In those opening days of Q4 trade NVDIA had a wide open door to breakout, as there was a massive stock buyback announced and quarterly numbers were very good. It did help the stock to hit a fresh ATH, but it’s what happened after that was alarming.
Sellers showed up near immediately after that ATH and the weekly bar closed as a bearish engulf. This earned it an appearance on the Top 5 Charts for that Week, and then a week later, a bearish engulf showed up on the weekly chart for S&P 500 futures.
Again – the deduction here is what matters as there was an apparent open door for bulls to make a massive move yet, instead, we saw distribution. That selling has only intensified ever since, with the index falling through the bottom of a rising wedge pattern and, as of this writing, grasping on to support at five-month-lows.
S&P 500 Weekly Chart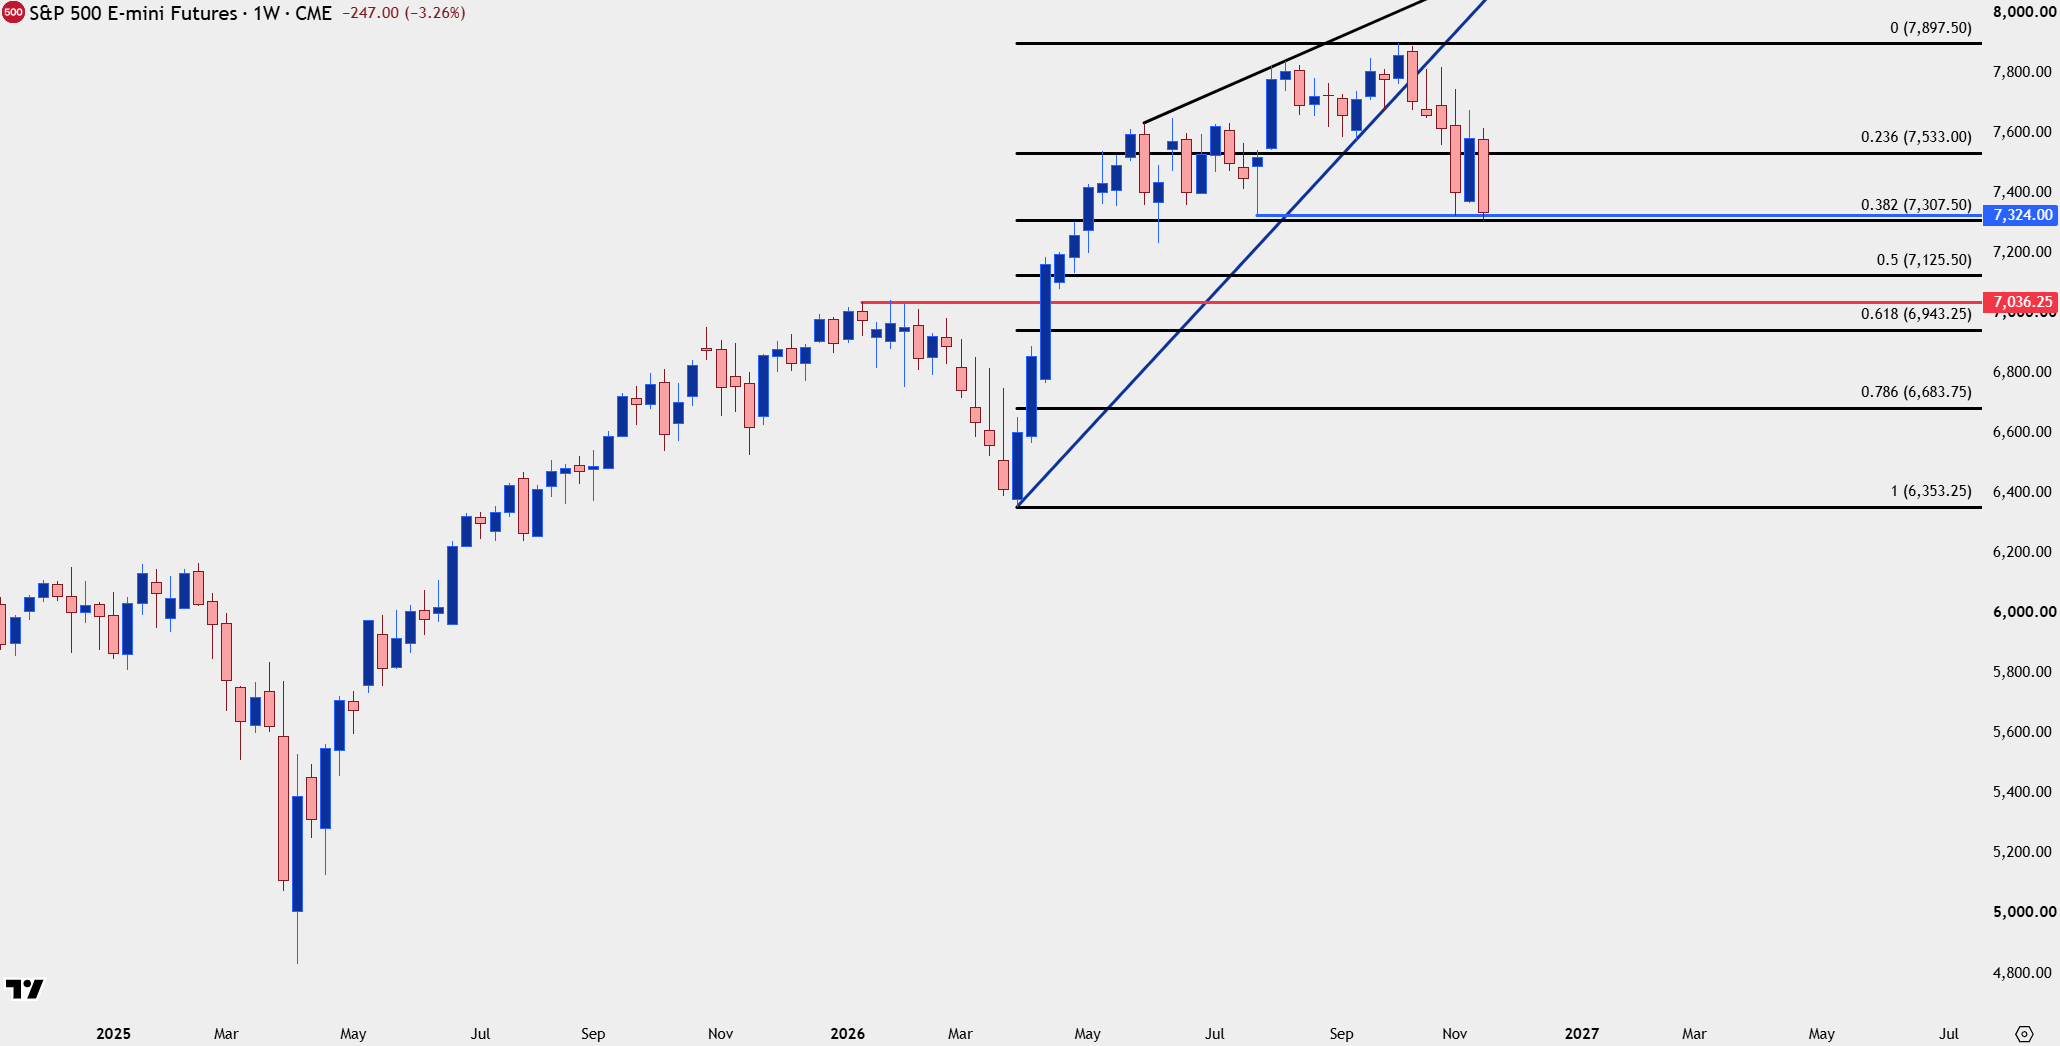
Chart prepared by James Stanley; data derived from Tradingview
S&P 500 Shorter-Term
At this point the sell-off in S&P 500 futures has paused at the 38.2% retracement of the April-October move for the past two days. This sets an important line in the sand as that matched low can spell for a double bottom formation on shorter-term charts. Those are often looked at as bullish reversal formations, although given the greater context here, that could simply be considered as a pullback in what’s become a broader bearish trend. I’ll look at that shorter-term setup a little lower but first, from the daily we can get better view of the bigger picture.
S&P 500 Daily Chart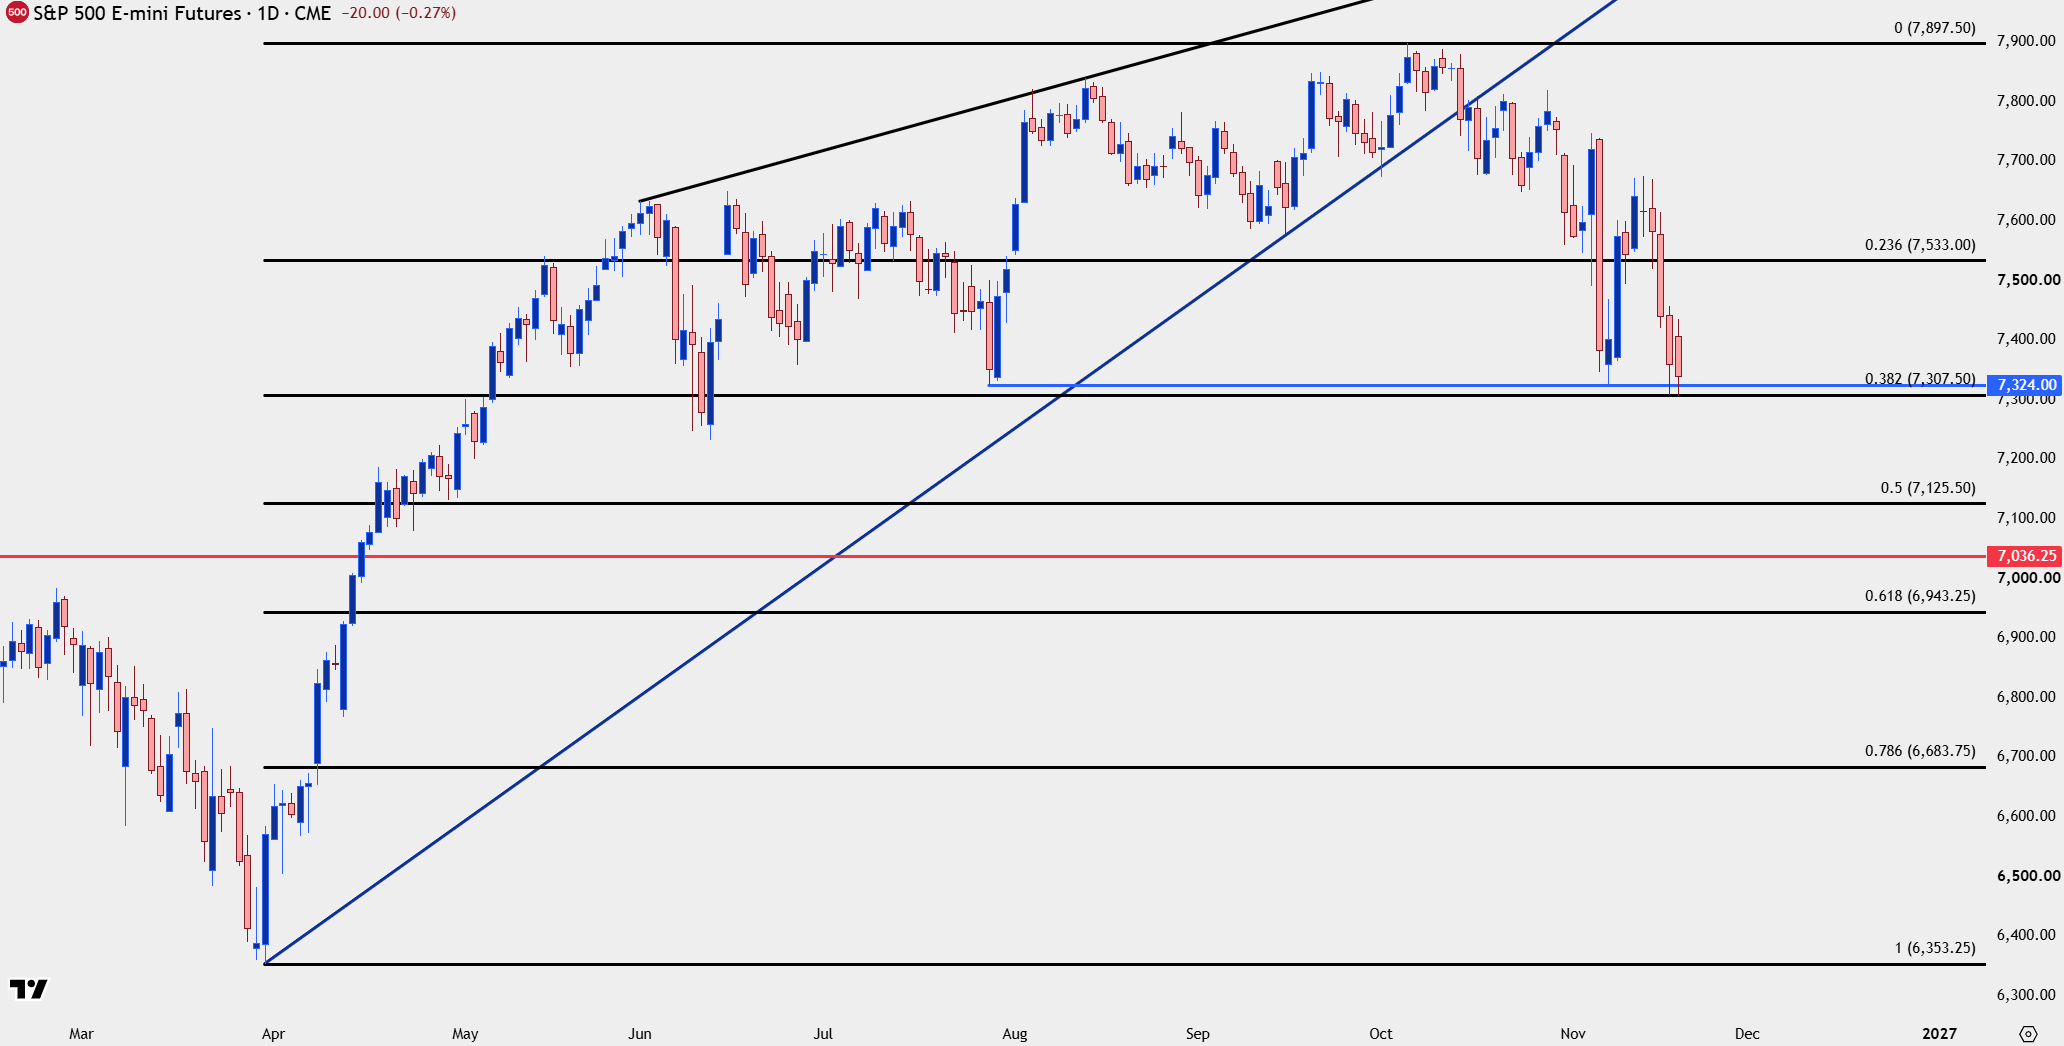
Chart prepared by James Stanley; data derived from Tradingview
S&P 500 Shorter-Term
At this point the possible double bottom formation presents potential up to just above the 7500 level. The way such formation will often be approached is a measured move from the two lows up to the neckline, or the high between those two lows, will project a move of approximately that size. In this case, there’s roughly 130 points between the lows and the neck, which, when added to the neckline points towards a move up to 7564.
Personally, I find it’s best to try not to get too pedantic around such projections especially if there’s a larger point of support or resistance nearby, which I do consider both 7500 and 7533 to be; but it does provide some important context for how this short-term formation could be treated in the bigger picture in the event that sellers are showing some degree of fatigue.
S&P 500 Four-Hour Chart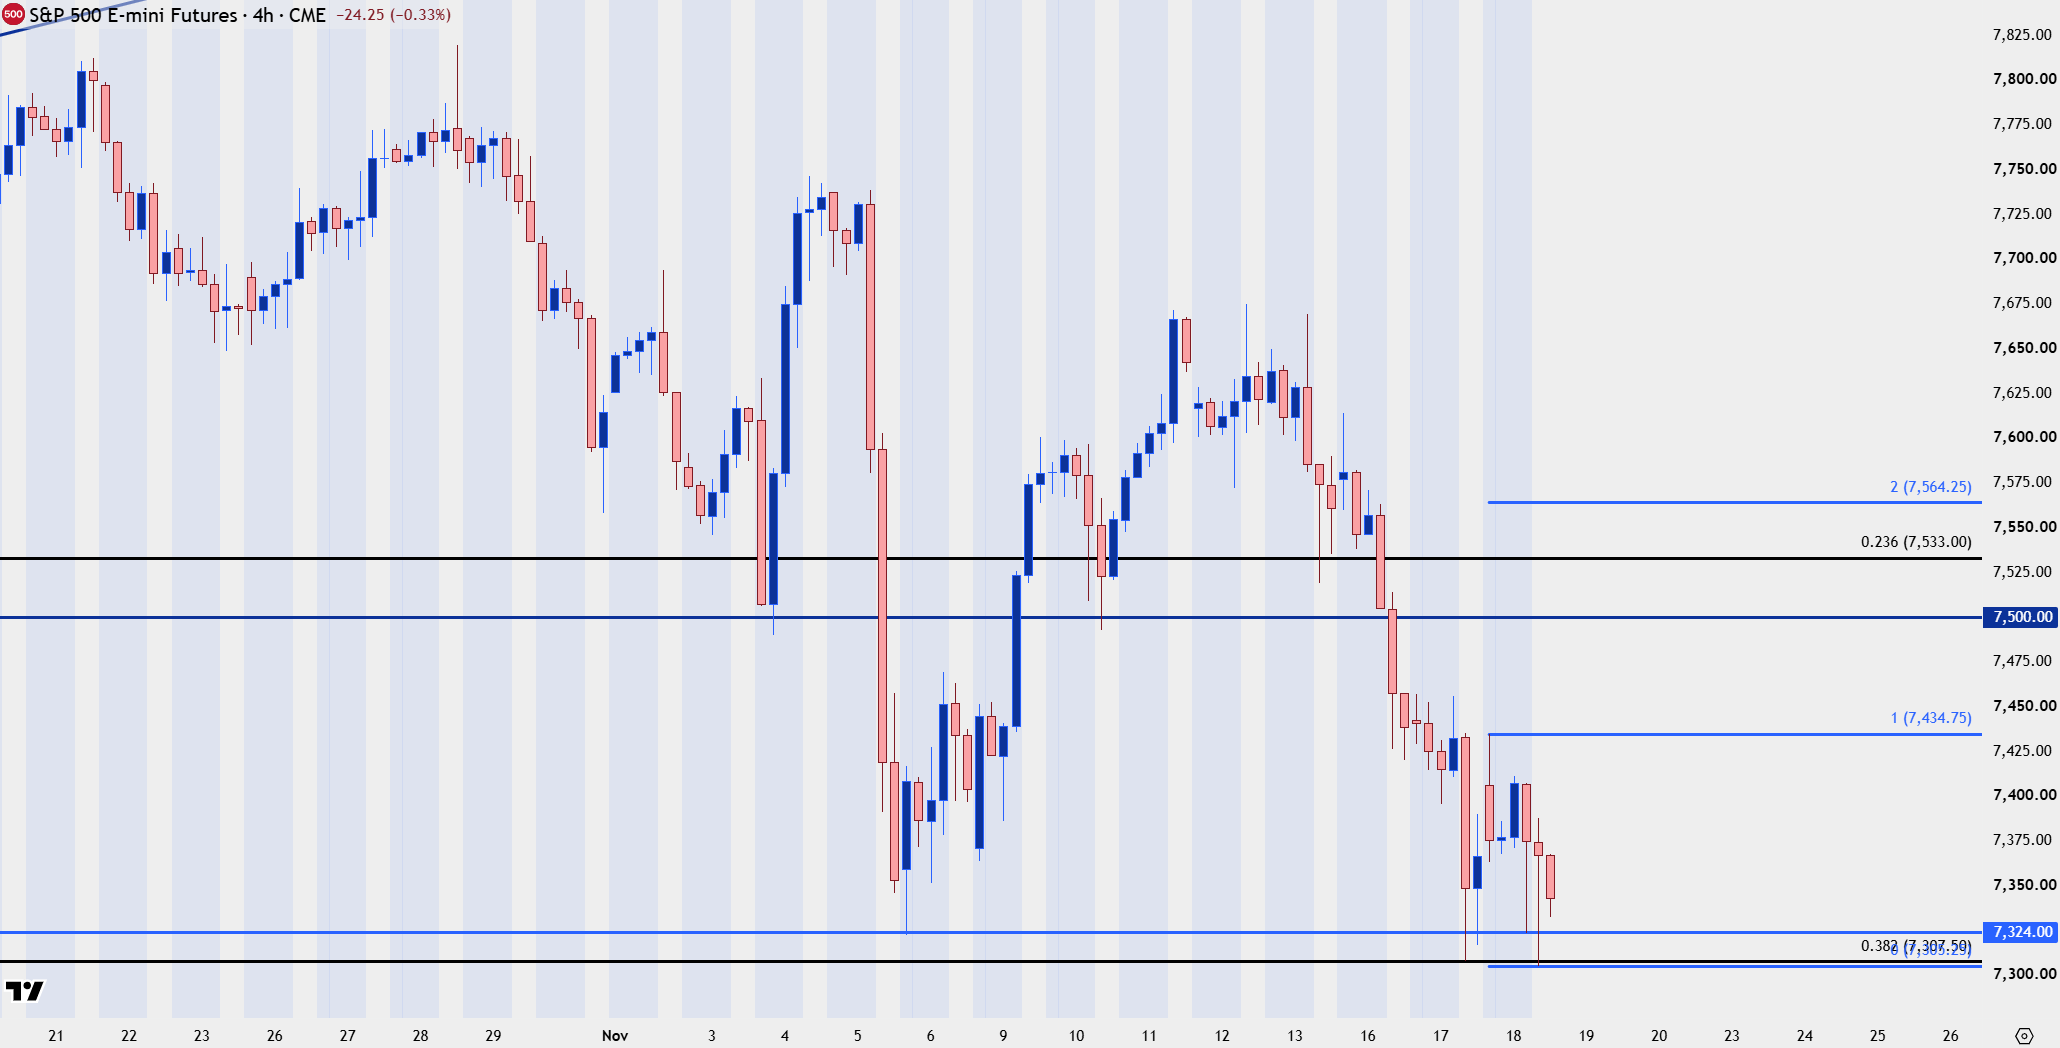
Chart prepared by James Stanley; data derived from Tradingview
--- written by James Stanley, Senior Market Analyst, Global Macro
Related tags:
Latest market news




Open an account in minutes
Experience award-winning platforms with fast and secure execution.
Economic calendar
Web Trader platform
Our sophisticated web-based platform is packed with features.
Related articles
S&P 500 Grasps At Support as Surging Hike Odds, Treasury Yields Threaten Larger Turn
Stocks continue to turn in Q4 and the post-earnings bounce from NVDA has been faded, while the S&P 500 grasps on to a support level with a large amount of open space below.
Gold Breaks Down but is This a Sign of What’s to Come?
Gold prices have broken down to a fresh yearly low and the next obvious level-lower is the $3500 spot that held the highs ahead of Jerome Powell’s Jackson Hole appearance last year.

Nasdaq 100 Forecast: NDX rises after Nvidia earnings calm AI worries
U.S. stocks are pointing to a higher open, with the tech-heavy Nasdaq leading the pack after Nvidia's upbeat revenue forecast eased some concerns about the chipmaker and helped sentiment towards AI stocks ahead of Anthropic's IPO pricing.

StoneX Financial Ltd (trading as "FOREX.com") is an execution-only service provider. This material, whether or not it states any opinions, is for general information purposes only and it does not take into account your personal circumstances or objectives. This material has been prepared using the thoughts and opinions of the author and these may change. However, FOREX.com does not plan to provide further updates to any material once published and it is not under any obligation to keep this material up to date.
This material is short term in nature and may only relate to facts and circumstances existing at a specific time or day. Nothing in this material is (or should be considered to be) financial, investment, legal, tax or other advice and no reliance should be placed on it. No opinion given in this material constitutes a recommendation by FOREX.com or the author that any particular investment, security, transaction or investment strategy is suitable for any specific person.
The material has not been prepared in accordance with legal requirements designed to promote the independence of investment research. Although FOREX.com is not specifically prevented from dealing before providing this material, FOREX.com does not seek to take advantage of the material prior to its dissemination. This material is not intended for distribution to, or use by, any person in any country or jurisdiction where such distribution or use would be contrary to local law or regulation. For further details see our full non-independent research disclaimer and quarterly summary.