



Two trades to watch: BP, oil
BP swings into profit. Oil steady ahead of API.
Share this:

BP swings into profit
Upbeat results from BP, are lifting the oil major and the FTSE
BP swung into profit amid surging oil and gas prices. Underlying replacement cost profit for 2021, a proxy for net profit reached $12.8 billion, up from a loss of $5.7 billion last year and ahead of consensus estimates of $12.5 billion.
In the fourth quarter net profit of $4.1 billion was recorded, above forecasts of $3.9 billion.
Oil prices are hovering around a 7-year high and gas prices rallied firmly in the final months of 2021.
The company also outlined plans to buy back $8.5 billion in shares in the first half of the year and said it expects to increase dividends by 4% to $0.25 per share in Q1.
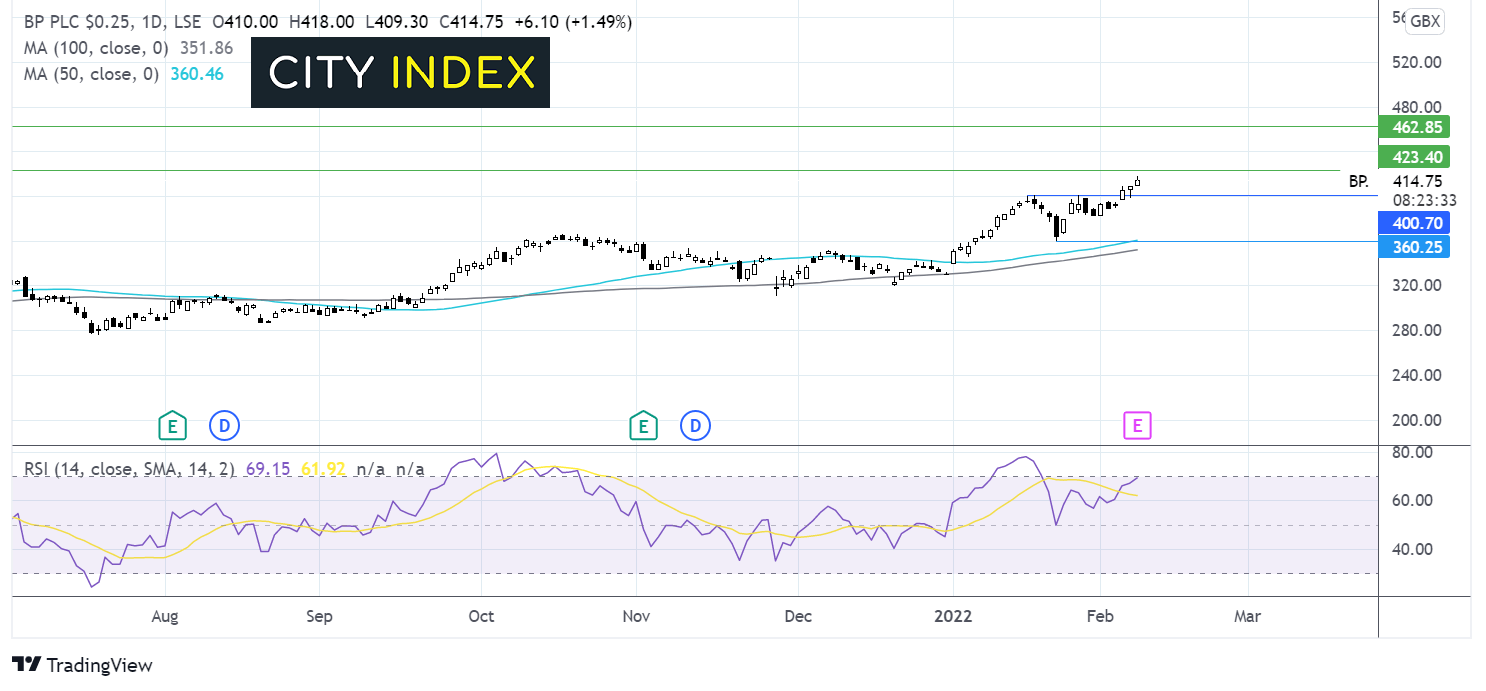
Where next for the BP?
BP trades 26% higher so far this year but remains below its pre-pandemic levels as it transitions to a greener outfit.
The share price trades above its 50 & 100 sma, and the RSI is supportive of further gains whilst is remains out of overbought territory.
Resistance can be seen at 426p a high from February 2020 and 460p the March 2020 high.
On the flip side, a move below 400p the psychological level and mid-January high could negate the near term uptrend, whilst a move below 360p the January 24 low and 50 sma is needed for sellers to gain momentum.
Oil steady ahead of API
Oil prices are edging lower for a third straight day, edging away from the recent 7-year highs. Oil prices are coming under mild pressure as attention turns towards US – Iran nuclear talks and the prospect of the release of Iranian oil back into the market.
Currently, sanctions imposed on Iran prevent its oil from being legally exported. Progress in US – Iran talks could see those sanctions lifted and oil supply levels rise considerably.
Tight supply and fears of supply disruption should Russia invade Ukraine have boosted oil prices even after OPEC+ said it would raise output quotas.
API inventory data is due late, a draw of -1.645 million barrels was recorded last week.
Where next for oil prices?
WTI oil continues to trade in a rising channel dating back to mid-December. It trades above its 50 & 100 sma and the 50 sma is crossing above the 100 in a bullish signal.
The price ran into resistance at 92.50 when the RSI moved into overbought territory so we could see some consolidation around these levels or even a move lower to bring the RSI out of overbought territory.
Support can be seen at $88.50 horizontal support and the lower band of the rising channel and the $86.20 the February 3 low.
On the upside, resistance sits at $92.50 the recent 7 year high ahead of 94.50 the upper band o the rising channel.


How to trade with City Index
Follow these easy steps to start trading with City Index today:
- Open a City Index account, or log-in if you’re already a customer.
- Search for the market you want to trade in our award-winning platform.
- Choose your position and size, and your stop and limit levels
- Place the trade.
Latest market news




Open an account in minutes
Experience award-winning platforms with fast and secure execution.
Economic calendar
Web Trader platform
Our sophisticated web-based platform is packed with features.
Related articles

Brazil Elections: Is Investor Confidence Beginning to Fade?
One of the most relevant events for emerging markets in recent sessions has been the outcome of Brazil’s presidential election. Following Lula da Silva’s victory in the second round, investor sentiment began to deteriorate noticeably. This can be observed in both the iShares MSCI Brazil ETF and the VanEck Brazil Small-Cap ETF, two important benchmarks for tracking the Brazilian equity market, both of which have posted declines of more than 15% at the start of the week.


Crude Oil Analysis: WTI Approaches $100 Amid Growing Supply Risks
Recent trading sessions continue to highlight a strong bullish bias across the oil market. As reflected in the performance of WTI crude, prices have maintained a solid recovery since the beginning of October and are now up more than 12% since October 8, a development that continues to underline the strength of demand in the short term.

Dow Jones Analysis: Is the DJIA Making a Comeback?
Recent trading sessions have become increasingly relevant for the Dow Jones, as the index has started to regain bullish momentum heading into the end of the week. Over the last three sessions, the DJIA has advanced by more than 0.6%, allowing buying pressure to regain prominence and raising the possibility of a more consistent short-term recovery.
StoneX Financial Ltd (trading as "FOREX.com") is an execution-only service provider. This material, whether or not it states any opinions, is for general information purposes only and it does not take into account your personal circumstances or objectives. This material has been prepared using the thoughts and opinions of the author and these may change. However, FOREX.com does not plan to provide further updates to any material once published and it is not under any obligation to keep this material up to date.
This material is short term in nature and may only relate to facts and circumstances existing at a specific time or day. Nothing in this material is (or should be considered to be) financial, investment, legal, tax or other advice and no reliance should be placed on it. No opinion given in this material constitutes a recommendation by FOREX.com or the author that any particular investment, security, transaction or investment strategy is suitable for any specific person.
The material has not been prepared in accordance with legal requirements designed to promote the independence of investment research. Although FOREX.com is not specifically prevented from dealing before providing this material, FOREX.com does not seek to take advantage of the material prior to its dissemination. This material is not intended for distribution to, or use by, any person in any country or jurisdiction where such distribution or use would be contrary to local law or regulation. For further details see our full non-independent research disclaimer and quarterly summary.