



US Core PCE follows EU CPI higher
Markets are pricing in a 75bps rate hike for both central banks. However, the meetings not until the end of October and there is still a lot of data which can change rate hike expectations
Share this:

The Fed’s favorite measure of inflation, Core PCE, was released for August earlier today. The print was 4.9% YoY vs an expectation of 4.7% YoY and a July reading of 4.7% YoY. This follows the September EU CPI Flash, which was 10% YoY vs an estimate of 9.7% YoY and a 9.1% YoY reading in August. For those who were hoping that inflation data was improving, these prints were just the shot in the arm they needed to bring them back to reality. Both the Fed and the ECB are expected to raise rates 75bps at their next respective meetings, and these prints should give confidence to the central banks when raising. In addition, there were many central bankers on the wires from both the ECB and the Fed this week. The common theme from them was that inflation is still too high and that 75bps seems an appropriate amount to raise rates. Also note that Germany’s inflation data was released yesterday, which also showed a 10% YoY increase vs a prior reading of “only” 7.4%!
EUR/USD has been moving in a downwards sloping channel since February, when the pair was trading near 1.1500. The pair first broke parity on July 14th, however bounced to resistance near the 1.0340/1.0350 area. EUR/USD broke parity once again on August 14th. The pair oscillated around that level for a month, until September 21st, when the pair finally broke lower towards the bottom trendline of the channel. On Wednesday, the pair made a low of 0.9536, its lowest level since June 2002. The pair has recently bounced back into the channel, running into horizontal resistance today at 0.9864.
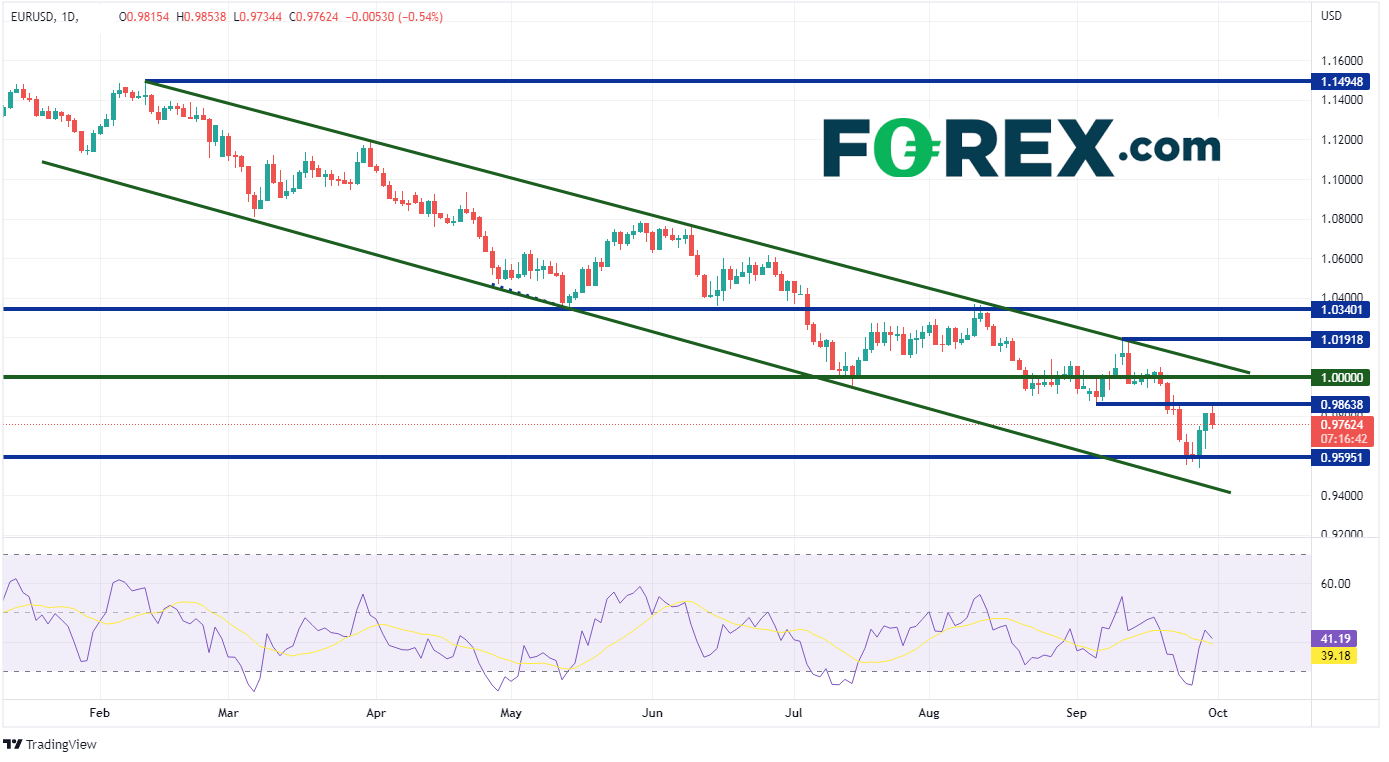
Source: Tradingview, Stone X
On a 240-minute timeframe, after putting in a 20-year low, EUR/USD bounced to near the 50% retracement level from the highs of September 12th to the lows of September 28th , near 0.9870. Above there, price can move to September 22nd highs at 0.9907, then the 61.8% Fibonacci retracement from the recently mentioned timeframe near 0.9947. However, if EUR/USD continues to move lower, the first support is at yesterday’s low of 0.9636, then the lows of September 22nd at 0.9542. If EUR/USD makes another 20-year low, the next level of support is the bottom trendline of the channel near 0.9340.

Source: Tradingview, Stone X
With higher than expected readings from both the August Core CPI from the US and the September Preliminary CPI from the Eurozone, higher rates from the US and the ECB are coming. The question is a not a matter of “if”, rather than “by how much”. Right now, markets are pricing in a 75bps rate hike for both central banks. However, the meetings not until the end of October and there is still a lot of data which can change rate hike expectations in a hurry!
The Fed’s favorite measure of inflation, Core PCE, was released for August earlier today. The print was 4.9% YoY vs an expectation of 4.7% YoY and a July reading of 4.7% YoY. This follows the September EU CPI Flash, which was 10% YoY vs an estimate of 9.7% YoY and a 9.1% YoY reading in August. For those who were hoping that inflation data was improving, these prints were just the shot in the arm they needed to bring them back to reality. Both the Fed and the ECB are expected to raise rates 75bps at their next respective meetings, and these prints should give confidence to the central banks when raising. In addition, there were many central bankers on the wires from both the ECB and the Fed this week. The common theme from them was that inflation is still too high and that 75bps seems an appropriate amount to raise rates. Also note that Germany’s inflation data was released yesterday, which also showed a 10% YoY increase vs a prior reading of “only” 7.4%!
EUR/USD has been moving in a downwards sloping channel since February, when the pair was trading near 1.1500. The pair first broke parity on July 14th, however bounced to resistance near the 1.0340/1.0350 area. EUR/USD broke parity once again on August 14th. The pair oscillated around that level for a month, until September 21st, when the pair finally broke lower towards the bottom trendline of the channel. On Wednesday, the pair made a low of 0.9536, its lowest level since June 2002. The pair has recently bounced back into the channel, running into horizontal resistance today at 0.9864.

Source: Tradingview, Stone X
Trade EUR/USD now: Login or Open a new account!
• Open an account in the UK
• Open an account in Australia
• Open an account in Singapore
On a 240-minute timeframe, after putting in a 20-year low, EUR/USD bounced to near the 50% retracement level from the highs of September 12th to the lows of September 28th , near 0.9870. Above there, price can move to September 22nd highs at 0.9907, then the 61.8% Fibonacci retracement from the recently mentioned timeframe near 0.9947. However, if EUR/USD continues to move lower, the first support is at yesterday’s low of 0.9636, then the lows of September 22nd at 0.9542. If EUR/USD makes another 20-year low, the next level of support is the bottom trendline of the channel near 0.9340.
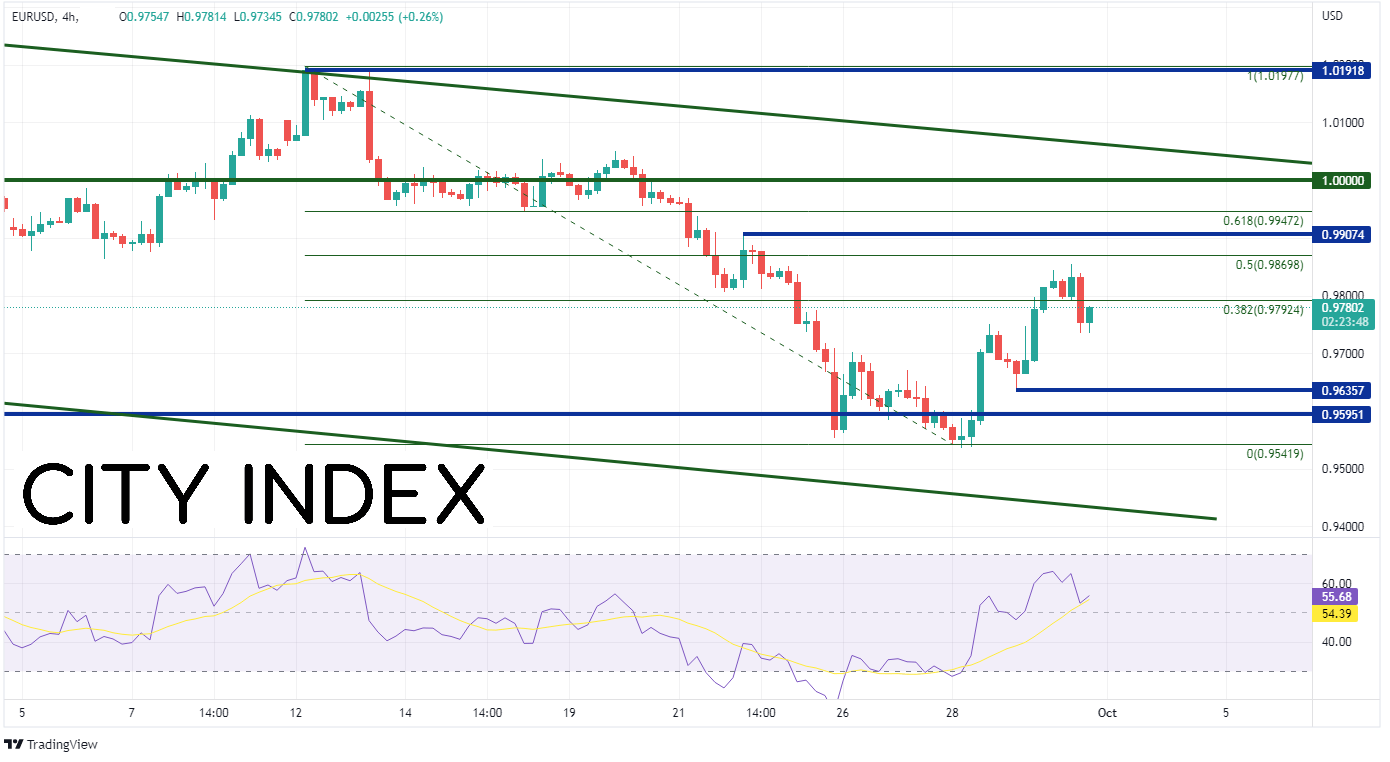
Source: Tradingview, Stone X
With higher than expected readings from both the August Core CPI from the US and the September Preliminary CPI from the Eurozone, higher rates from the US and the ECB are coming. The question is a not a matter of “if”, rather than “by how much”. Right now, markets are pricing in a 75bps rate hike for both central banks. However, the meetings not until the end of October and there is still a lot of data which can change rate hike expectations in a hurry!
Learn more about forex trading opportunities.
Related tags:


Open an account in minutes
Experience award-winning platforms with fast and secure execution.
Economic calendar
Web Trader platform
Our sophisticated web-based platform is packed with features.
Related articles
US dollar rally loses yield support as Nvidia looms
US yields are retreating, but the dollar isn't following. With risk aversion potentially keeping it supported, Nvidia's results could determine whether emerging reversal signals in AUD/USD and EUR/USD develop further.

GBP/USD, GBP/JPY, GBP/AUD: Sterling Eyes UK Inflation Catalyst
Sterling faces a pivotal UK inflation test as traders weigh BoE tightening, Fed minutes and Australian employment data across GBP/USD, GBP/JPY and GBP/AUD.


USD/MXN Forecast: Is Super Peso Making a Comeback?
The latest trading sessions have once again highlighted the strength of the Mexican peso. The currency has managed to regain a consistent appreciation trend in the short term, even despite the renewed strength displayed by the U.S. dollar in recent sessions.

StoneX Financial Ltd (trading as "FOREX.com") is an execution-only service provider. This material, whether or not it states any opinions, is for general information purposes only and it does not take into account your personal circumstances or objectives. This material has been prepared using the thoughts and opinions of the author and these may change. However, FOREX.com does not plan to provide further updates to any material once published and it is not under any obligation to keep this material up to date.
This material is short term in nature and may only relate to facts and circumstances existing at a specific time or day. Nothing in this material is (or should be considered to be) financial, investment, legal, tax or other advice and no reliance should be placed on it. No opinion given in this material constitutes a recommendation by FOREX.com or the author that any particular investment, security, transaction or investment strategy is suitable for any specific person.
The material has not been prepared in accordance with legal requirements designed to promote the independence of investment research. Although FOREX.com is not specifically prevented from dealing before providing this material, FOREX.com does not seek to take advantage of the material prior to its dissemination. This material is not intended for distribution to, or use by, any person in any country or jurisdiction where such distribution or use would be contrary to local law or regulation. For further details see our full non-independent research disclaimer and quarterly summary.