- Front-end US rates remain the dominant USD/JPY driver
- Intervention risk is capping upside near the 160 area
- Positive carry remains despite higher Japanese funding costs
- Yen positioning has shifted sharply without sustained USD/JPY downside
- US inflation and payrolls remain the key Fed catalysts
- Technicals point to 155–160 as the key year-end range
The Fed remains firmly in the driving seat
When thinking about how USD/JPY is likely to finish 2026, the outlook really comes down to one question: where does the Fed rates path go from here?
Markets have already built in a very hawkish outlook for the funds rate. We’ve already seen the first rate increase in more than three years in September, while there is strong conviction another will follow before year-end, potentially as soon as October.
That seems a fair assessment given the persistence of inflation and the strength of the US economy seen to date. But if either were to change, it could materially alter the outlook not only for the funds rate, but also USD/JPY.
For all the noise and headlines traders have to absorb each day, the honest view is that most of it can be dismissed. Outside intervention episodes and the odd Japan-specific driver, USD/JPY takes its cues primarily from front-end US rates, making the Fed outlook the single most important macro input into how the pair finishes the year.
Intervention muddies an otherwise clear macro signal
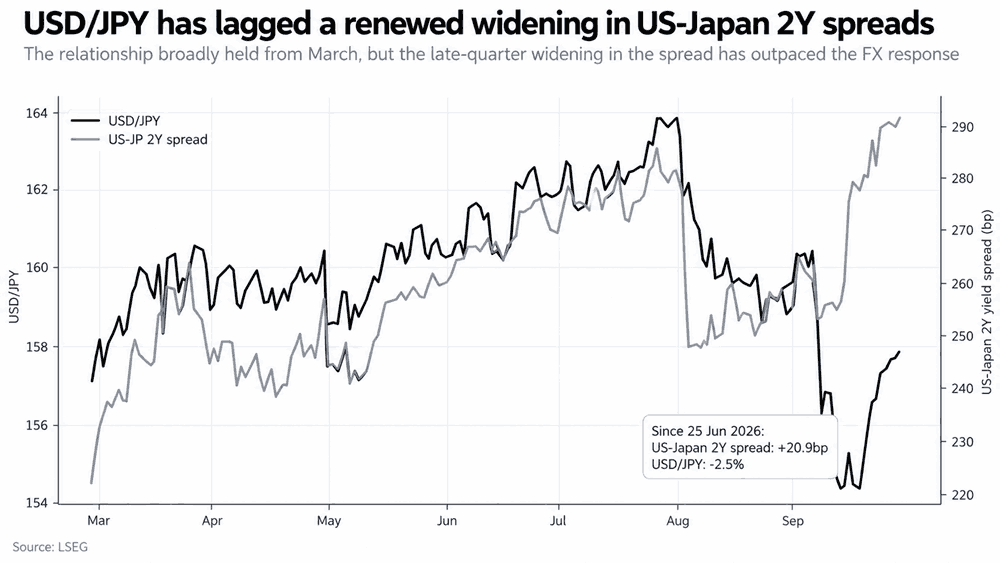
The next two graphics underline the importance of front-end pricing, showing how recent intervention episodes, firstly from Japan’s Ministry of Finance and secondly a joint effort between the MOF and US Treasury, have disrupted what was a strong positive relationship between the two variables.
Source: LSEG
Prior to those episodes the relationship was obvious, reinforcing that relative rate expectations, rather than idiosyncratic Japanese factors, were largely responsible for driving USD/JPY to fresh multi-decade highs earlier this year.
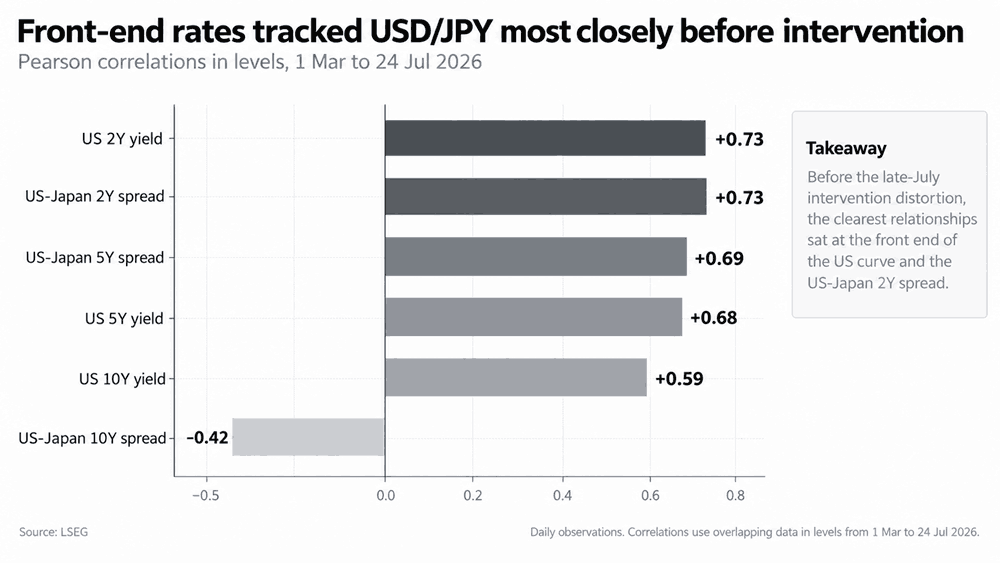
From the start of March through to July 24, USD/JPY’s correlation with both the US 2-year yield and US-Japan 2-year spread stood at around +0.73, with the relationship weakening further along the curve.
Source: LSEG
Since then, intervention has disrupted the relationship. Even with the threat of continued intervention, the message from the correlation remains intact, suggesting traders should remain focused on the Fed outlook for the strongest macro signal.
Relative rates underpin USD strength
We’ve seen a significant hawkish recalibration from both the Fed and BOJ in recent months, coinciding with persistently high energy prices as a result of ongoing conflicts in the Middle East and Eastern Europe.
Source: LSEG
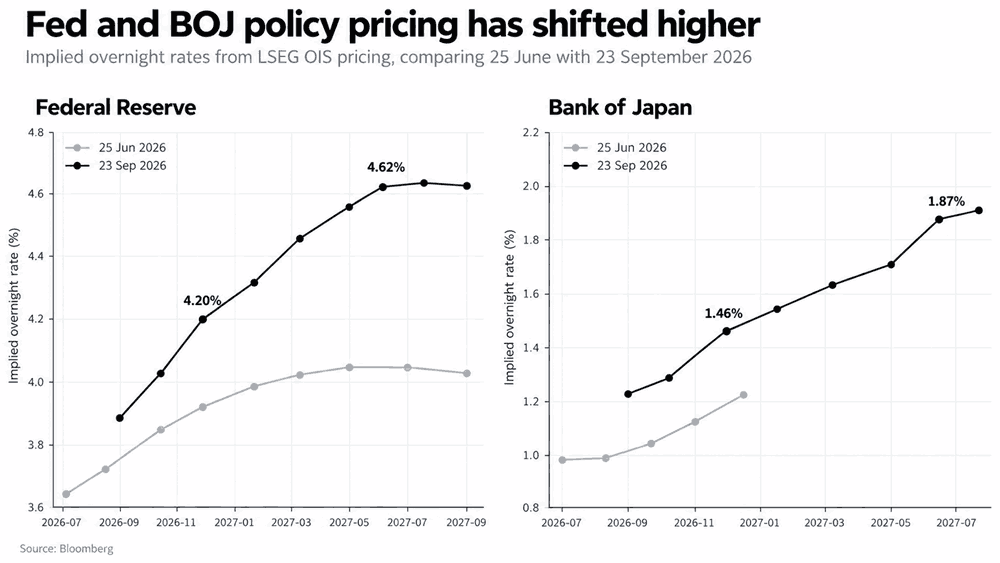
As you can see in the graphic above, markets now have around three and a half additional Fed hikes priced by June next year, while the BOJ curve also has another two and a half hikes priced beyond that delivered in September.
Even with the move in the Japanese curve, it still pales in comparison with what we’re seeing in the United States, both in terms of magnitude and the absolute level of policy rates, helping to explain the buoyancy in USD/JPY despite the BOJ’s hawkish shift.
Three risks to current Fed pricing
The most obvious risks to hawkish Fed pricing come from three distinct areas.
The first is the AI capex build-out, which has seen business investment surge this year. There is clearly a lot of hype embedded in valuations and the rollout itself, with medium to longer-term risks coming from elevated borrowing costs and power constraints that could curtail investment. But in the near term, it remains difficult to see any of that happening over such a short period in the final quarter, making it more of a low-probability but potentially large left-tail risk for USD/JPY.
The second is an abrupt and lasting peace agreement that sends energy prices sharply lower, greatly reducing the risk that second-round inflationary effects continue to build. US President Donald Trump has been increasingly insistent that he expects a deal with Iran to be reached right after the midterm elections. But given how many times sentiment around the conflict has shifted, it remains extremely difficult to put much weight on that as a base case.
As is often the case, it will likely come down to the US consumer, by far the largest and most important part of the US economy. While retail sales and broader household spending have remained extremely strong this year, confounding what many expected to see, you can’t ignore that personal saving rates are low, while wage growth remains tepid, flirting either side of being positive and negative in real terms. In a sticky inflation environment with elevated energy costs, there are clearly downside risks to spending.
However, these same headwinds have been in place for some time, yet there has been no meaningful sign of household spending buckling. So while the US consumer remains the most obvious swing factor, you can’t price in a meaningful left-tail risk for USD/JPY until there is clear evidence of it occurring.
Carry unwind fears look premature for now
The other key risk traders should be alert to is the potential for an unruly carry trade unwind, often dubbed by some market participants as a reverse carry trade, similar to what markets experienced in August 2024.
Back then, a stronger yen, collapsing US rate expectations and falling asset prices combined to force an aggressive reversal of leveraged positions, helping amplify the broader market selloff.
The ingredients for a repeat are easy enough to identify: a rapidly strengthening yen, a sharp compression in the yield pickup available from funding in Japan and a simultaneous decline in the assets those trades are financing.
Source: LSEG
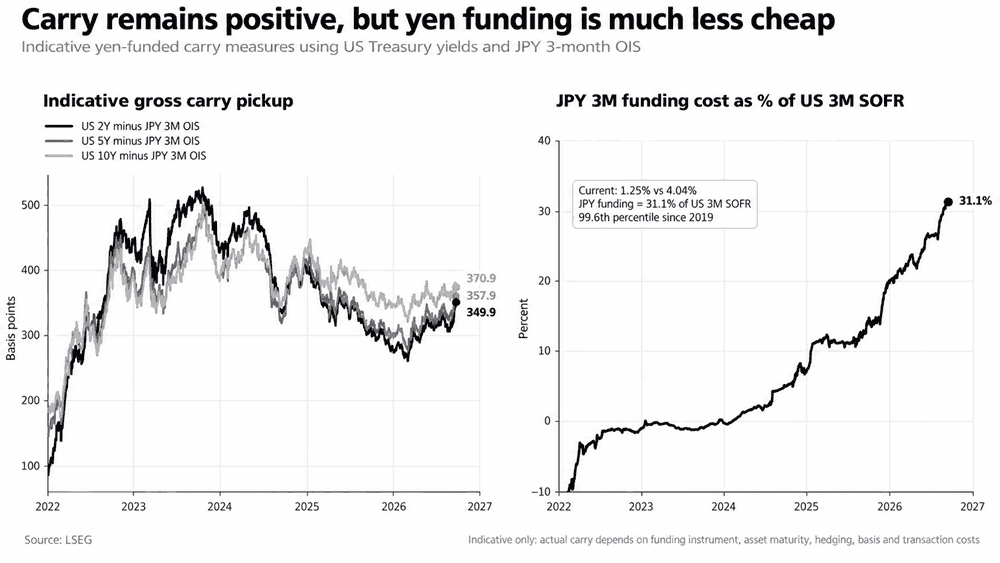
But right now, those conditions are not in place. Even after the recent compression in US yields, our indicative measures still show a gross rate pickup of roughly 350 to 370 basis points across 2, 5 and 10-year US Treasuries after subtracting three-month JPY OIS, which has been used as a proxy for the funding rate.
Clearly, this is only a rough guide rather than a complete measure of realised carry, which will vary depending on funding structure, maturity, the asset being held, basis and transaction costs. But even using this rough assessment, the carry pickup remains substantial.
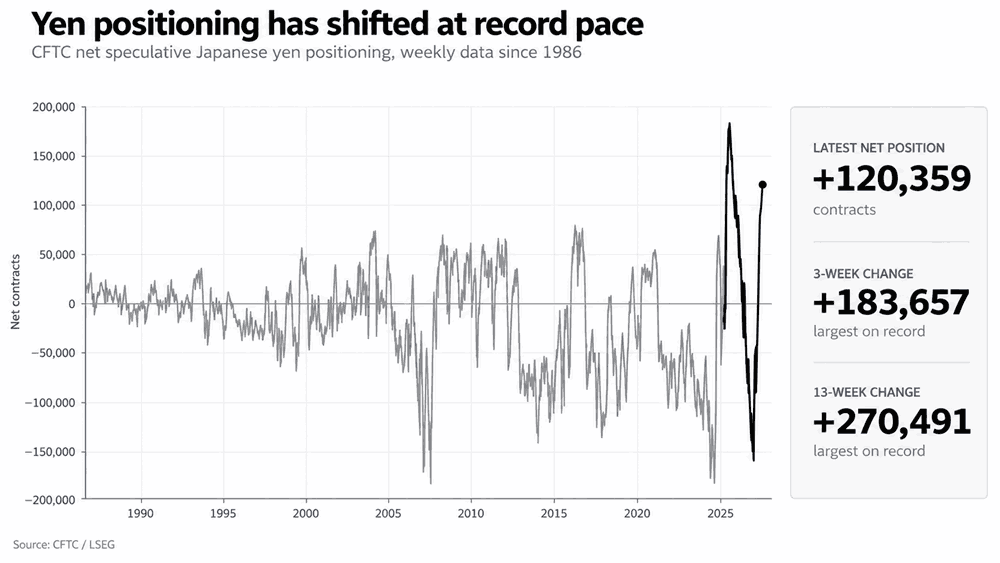
And while speculative positioning has swung heavily in favour of the yen, that shift has not been accompanied by meaningful downside in USD/JPY. According to the latest CFTC data, net speculative yen positioning has risen to +120,359 contracts, with the three-week change the largest on record.
Source: LSEG
Despite that extraordinary and rapid shift, the yen is not screaming higher and asset prices are still holding up despite everything thrown at them. The conditions for an unruly carry unwind are simply not yet in place.
That doesn’t mean the risk can be totally dismissed. It’s something traders should remain alert to if those conditions begin to shift, but for now the risk looks comparatively small heading into year-end.
Event risk narrows to a handful of key releases
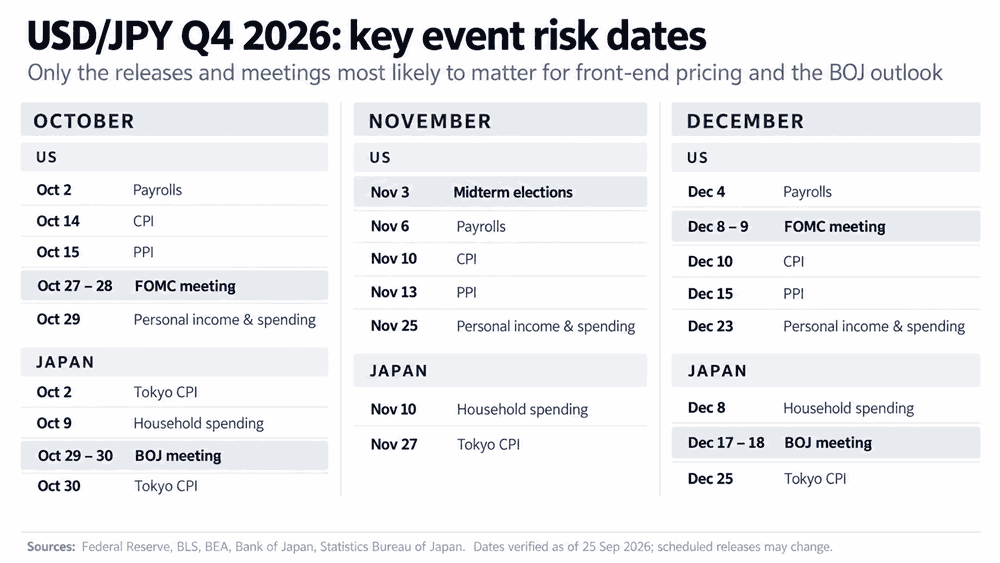
The main event risk over the remainder of the year remains concentrated in a relatively small number of releases capable of materially shifting front-end rate expectations.
Source: LSEG, TradingView
In the US, payrolls and inflation remain the key reports. CPI and PPI provide the earliest read on whether price pressures are continuing to broaden, while payrolls will be important in determining whether labour market conditions remain firm enough to allow the Fed to keep its focus squarely on the inflation side of its dual mandate.
The personal income and spending report is also worth watching, although less for core PCE inflation itself. By the time it is released, markets will already have a reasonably good idea of the inflation picture from CPI and PPI. More useful will be the read on household income, consumption and saving, providing a regular report card on whether the US consumer can continue to absorb elevated prices and borrowing costs.
The US midterm elections are another risk worth keeping on the radar. With polling moving against Republicans, there is a growing possibility Trump loses control of at least one house of Congress, if not both, leaving him a lame-duck president for the second half of his term.
That would likely mean greater policy gridlock and less scope to push through fresh reflationary or pro-growth measures. But unless the result materially changes existing policy settings, it is difficult to see the midterms becoming a dominant driver of USD/JPY, particularly with the AI investment build-out already firmly underway.
When it comes to Japanese data, while it should not be completely ignored, it screens as a distant secondary consideration. Tokyo inflation, wages and household spending provide the most useful reads on whether the virtuous cycle between firmer demand, higher wages and inflation is continuing to develop, which is key to underpinning the BOJ’s hawkish outlook.
But recent experience suggests BOJ communication, either directly through speeches in the weeks before policy decisions or indirectly via sourced media placement, is far more important when it comes to shifting Japanese pricing for BOJ rate decisions.
Rapid rebound puts August highs back in play
Source: TradingView
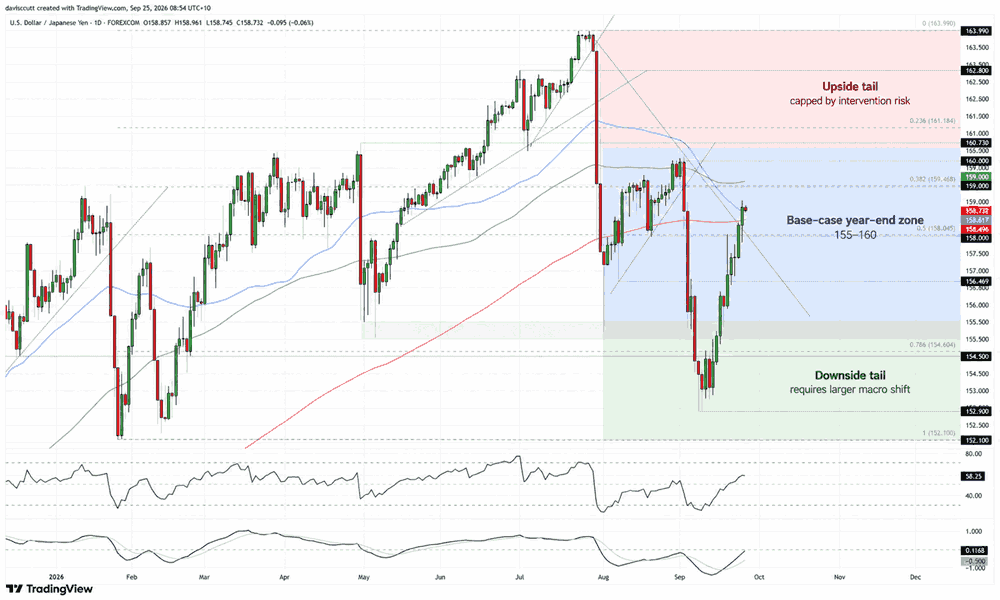
From a technical perspective, the velocity of the rebound following the twin waves of intervention in late July and early August, and again in early September, has been telling in terms of directional risk when the threat of intervention is removed.
The latest thrust higher has seen USD/JPY break the downtrend from the multi-decade highs struck in July and reclaim both the 200-day and 50-day moving averages. Momentum indicators have strengthened alongside the move, with RSI (14) pushing above 50 and trending higher, while MACD has staged a bullish crossover of its signal line and is close to flipping positive.
Taken together, the signals suggest upside risks are building, putting a potential retest of the August highs back in play.
The immediate hurdle is the zone around 159.50, where the 38.2% Fibonacci retracement of the 2026 low-to-high move sits alongside the 100-day moving average. Above there, 160.20 and 160.73 are the next levels to watch.
A break above the August highs would be more significant, ending the sequence of lower highs that has been in place since July and strengthening the case for a broader push higher.
On the downside, the 200-day moving average, currently around 158.48, provides the first level of support. Below that, 158.00 is another important area, sitting close to the 50% retracement of the 2026 low-to-high move and having acted as horizontal support and resistance previously.
Further down, 156.68 is another level to watch, followed by a more pronounced support zone around 155.00. That area absorbed a substantial amount of selling during the various intervention episodes seen this year. While USD/JPY did briefly break beneath it, the speed of the rebound once the intervention threat faded shows how quickly buyers returned at lower levels.
Intervention above, dip buyers below
When assessing both the fundamental and technical picture, the most logical year-end range for USD/JPY appears to sit broadly between 155 and 160.
The upper end may remain capped by ongoing intervention risk, with recent actions from Japanese and US authorities making it clear that moves towards and above 160 are unwelcome.
At the same time, the sharp rebound from beneath 155 suggests bulls are waiting in numbers to buy the dip once intervention pressure fades, providing a natural floor at the other end of the range.
With markets already pricing a hawkish path for both the Fed and BOJ, it is difficult to see either central bank becoming materially more hawkish in the near term. Given the dominant influence of the US front end, that arguably leaves directional risk tilted modestly sideways-to-lower into year-end, rather than pointing to another run at the July high near 163.99.