
Bitcoin is currently posting a streak of three consecutive bullish sessions, during which price has gained more than 3%, returning to the highest levels seen in recent months, above the $90,000 area. For now, the renewed buying pressure taking hold in the cryptocurrency appears to be driven, in part, by a reactivation of institutional demand in the short term, along with a recent indecisive tone in U.S. dollar strength, which has allowed alternative assets such as BTC to regain ground. Both catalysts could continue to support sustained buying pressure in Bitcoin over the coming sessions, provided no unexpected developments undermine the confidence that the market is beginning to rebuild.

Bitcoin Begins to Show Short-Term Appeal
Although confidence in Bitcoin buying was not particularly strong at the start of the year and periods of persistent indecision were observed, recent institutional market dynamics have started to paint a more constructive picture. This improvement is reflected both in Bitcoin ETF net flows and in the behavior of Open Interest, an indicator that measures the total number of open long and short positions in the institutional market.
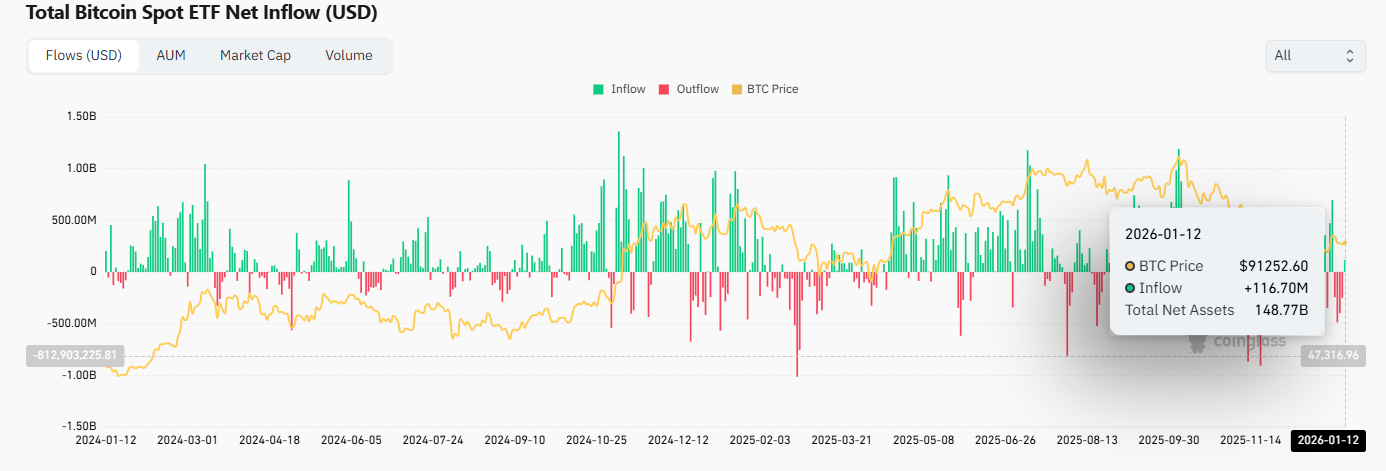
First, Bitcoin ETF net flow data show that after a notable outflow last week, early readings for this week indicate a capital inflow of more than $100 million, recorded on January 12. This move has broken the streak of outflows that had been dominating the institutional market, suggesting that buying interest is beginning to re-emerge in the short term.
Source: Coinglass
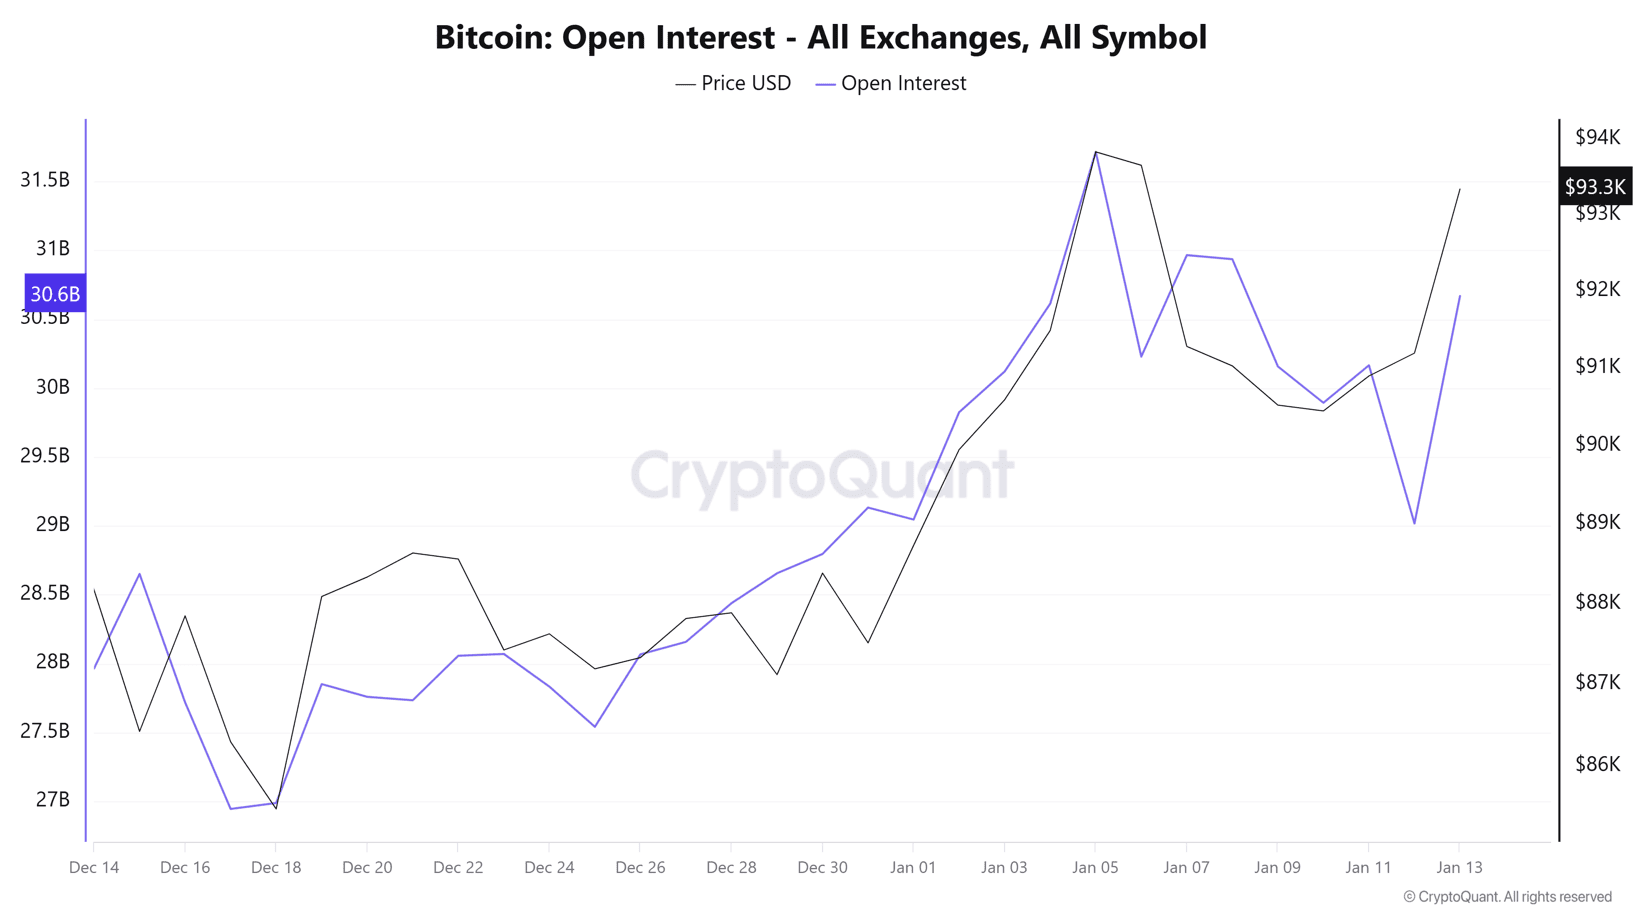
At the same time, Open Interest has regained a positive slope, showing sustained growth toward the $30.6 billion area. This behavior points to increased liquidity, volatility, and participation in Bitcoin’s derivatives market. When combined with rising prices, it suggests that the growth in Open Interest is primarily linked to an increase in long positions, rather than hedging or short exposure.
Source: Cryptoquant
Taken together, these institutional demand indicators are beginning to signal a renewed sense of confidence in the short term. As long as capital flows continue to enter the institutional Bitcoin market consistently, a more dominant demand profile could take shape, reinforcing buying pressure in price action over the coming sessions.
Is the U.S. Dollar Starting to Lose Momentum?
Earlier today, U.S. annual inflation data (CPI Y/Y) were released, coming in at 2.7%, in line with market expectations. This reading suggests that there is no additional inflationary pressure forcing the Federal Reserve to maintain a more aggressive monetary stance. As a result, the outlook for neutral or even lower interest rates has limited the U.S. dollar’s ability to sustain consistent buying strength in recent sessions.
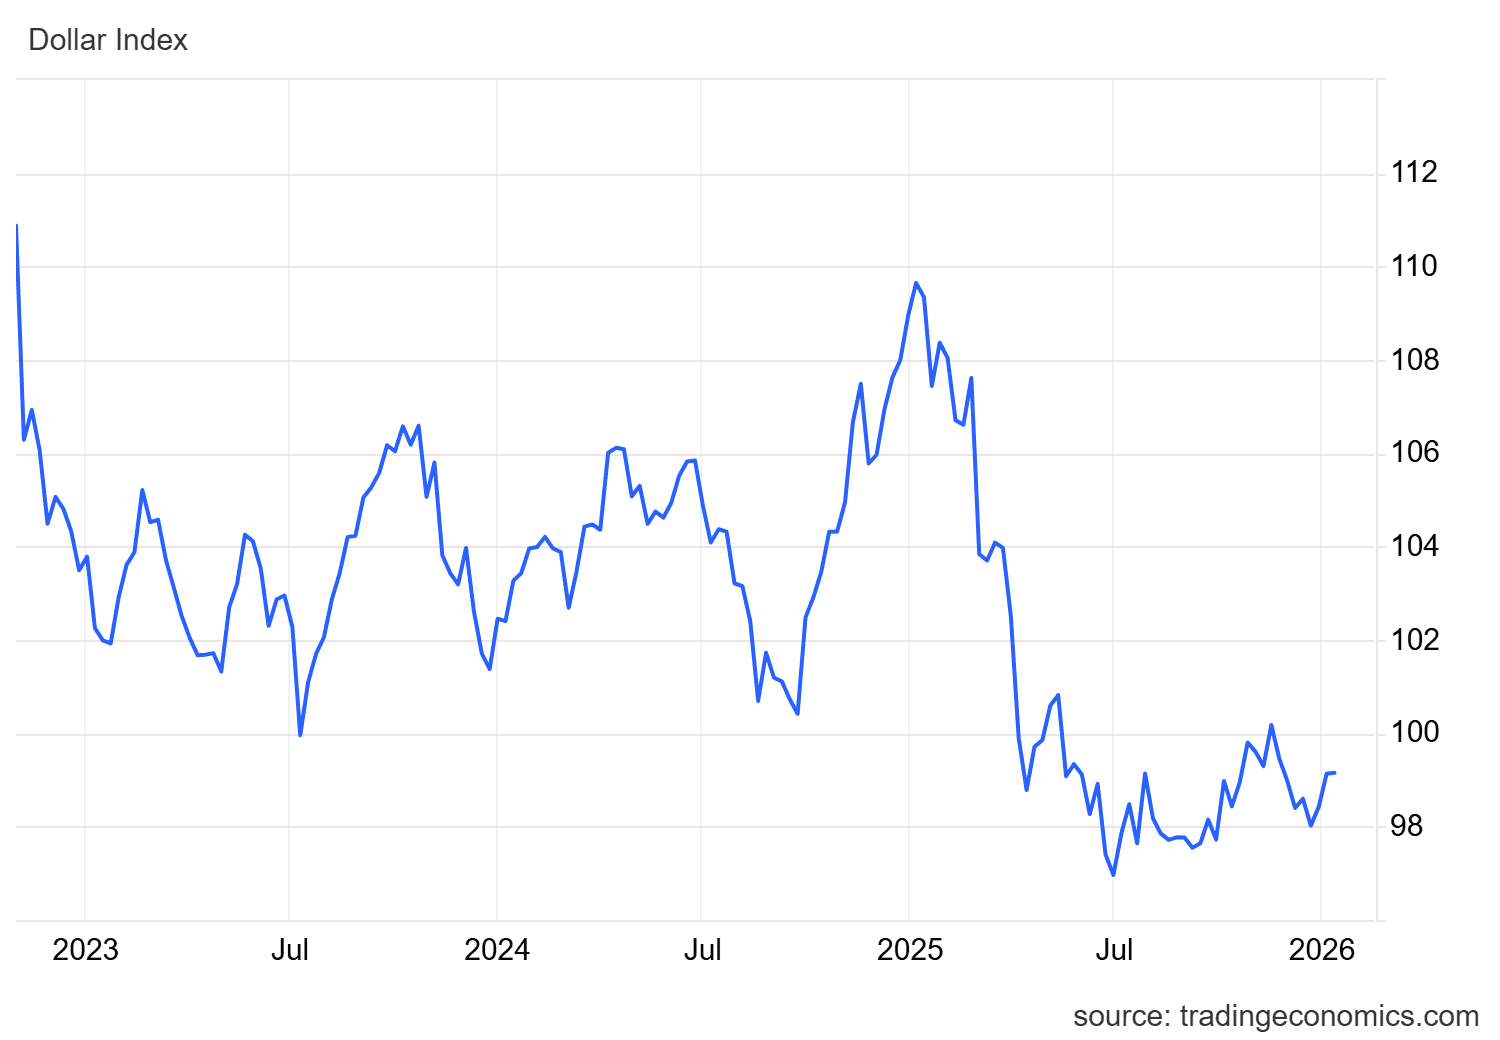
At present, the DXY index, which measures the dollar’s strength against other currencies, is showing a notable flattening around the 99-point level, failing to establish a fresh bullish impulse. This behavior reinforces an environment of indecision in dollar demand.
Source: TradingEconomics
As long as demand for U.S. dollars fails to recover decisively, risk and alternative assets, such as Bitcoin, may continue to gain relative appeal in the short term. From a substitute-asset perspective, this backdrop could encourage a rotation of flows into Bitcoin, allowing buying pressure to remain in place over the coming sessions—provided the dollar does not regain sustained strength.
Bitcoin Technical Outlook
Source: StoneX, Tradingview
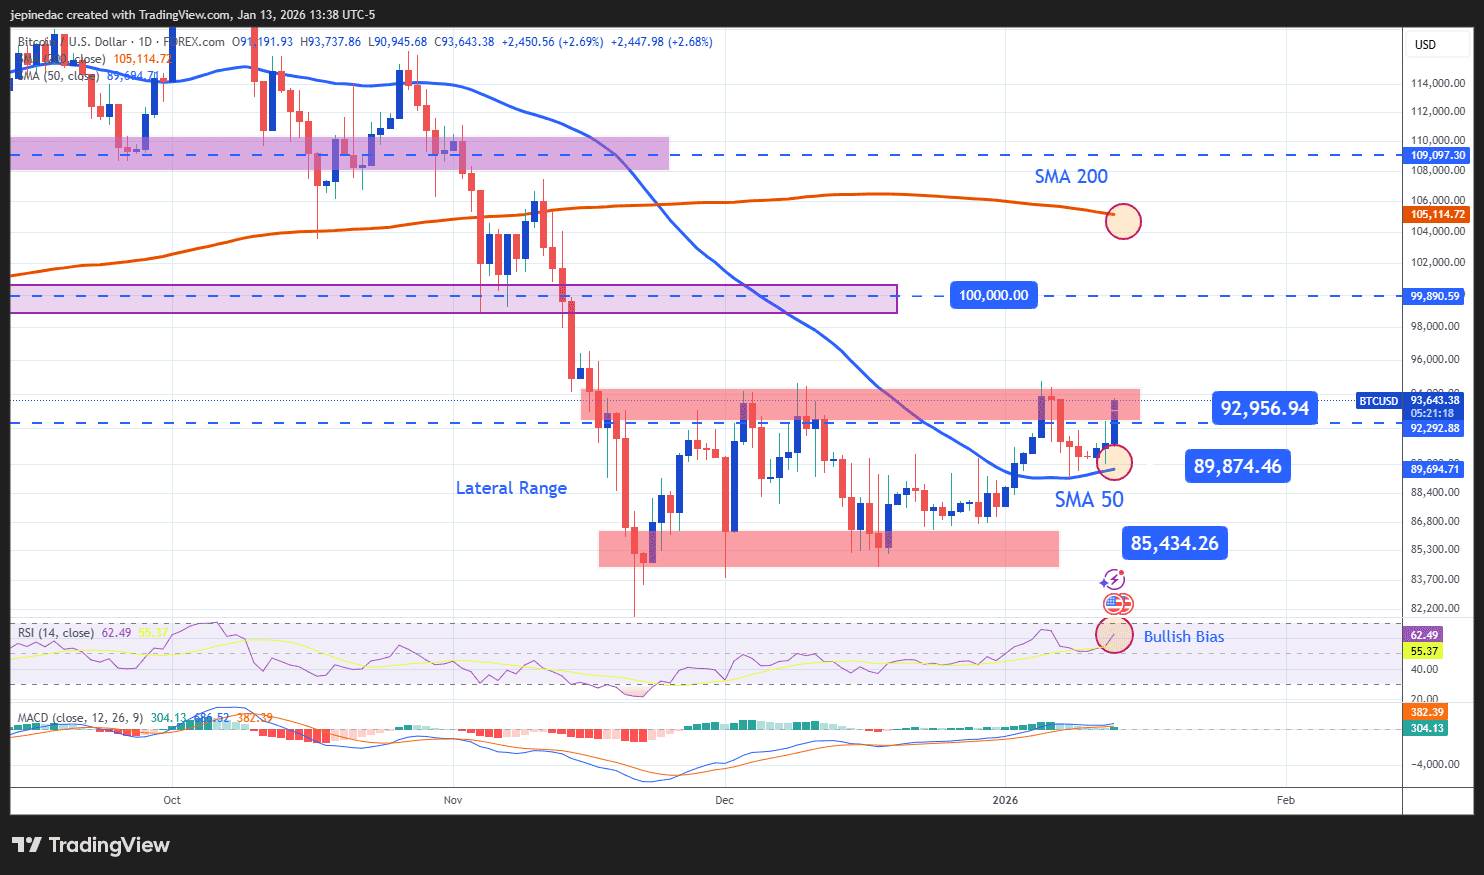
- Sideways price action remains relevant: Since late November, Bitcoin has traded within a well-defined sideways range, capped near $93,000 and supported around $85,000. As long as price continues to oscillate within these boundaries, the lack of a clear trend is likely to dominate BTC behavior and limit the emergence of stronger directional moves. That said, price is once again testing the upper boundary of this range, which—if buying pressure holds—could open the door to a more meaningful bullish bias in the sessions ahead.
- RSI: The RSI remains above the neutral 50 level, indicating that buying momentum has gained relevance. If the indicator continues to trend higher, it could further support stronger upside pressure on the Bitcoin chart.
- MACD: The MACD shows a histogram firmly in positive territory, above the zero line, suggesting that short-term moving average momentum currently favors buyers. An expanding histogram could confirm a clearer bullish dominance in the coming sessions.
Key Levels:
- 92,956 – Key resistance: A zone of recent highs that aligns with the upper boundary of the sideways range. A sustained close above this level could pave the way for the formation of a dominant short-term bullish trend.
- 89,874 – Nearby barrier: A support level aligned with the 50-period simple moving average. As long as price remains near this area, the sideways range is likely to continue dominating BTC price action.
- 85,434 – Major support: A level corresponding to the lows of recent months and the most relevant downside barrier to monitor. A return toward this area could reactivate the bearish trend that prevailed through much of 2025.
Written by Julian Pineda, CFA, CMT – Market Analyst
Follow him on: @julianpineda25