
- Uptober rally fizzled mid-month
- Correlation with Nasdaq near zero
- Downside favoured over hourly and daily timeframes
BTC/USD Summary
Uptober’s bullish reputation hasn’t held up this year, with Bitcoin reversing sharply and breaking down correlations with risk assets. While Nasdaq and other high-beta markets rip higher, BTC/USD remains under pressure, with technical signals leaning bearish. Key levels at $109,420 and $107,500 will dictate near-term setups as traders weigh whether this reversal deepens or sparks a late-month recovery.
Uptober Faded
October has earned the nickname “Uptober” in crypto circles thanks to its reputation as one of Bitcoin’s most bullish months historically. Seasonal factors impacting trading activity and sentiment have often combined to deliver strong gains, making October a standout performer compared to other months.
So far this year, Uptober hasn’t gone to plan for Bitcoin bulls. Instead of seasonal strength, the price action has remained subdued with an early rally fizzling midway through the month, delivering an ugly reversal that may not be over yet. What’s more, Bitcoin has failed to respond to gains in other asset classes it has historically tracked, lagging badly in an environment where so many high-beta markets are ripping higher.
Bitcoin Lags High-Beta Plays
Source: TradingView
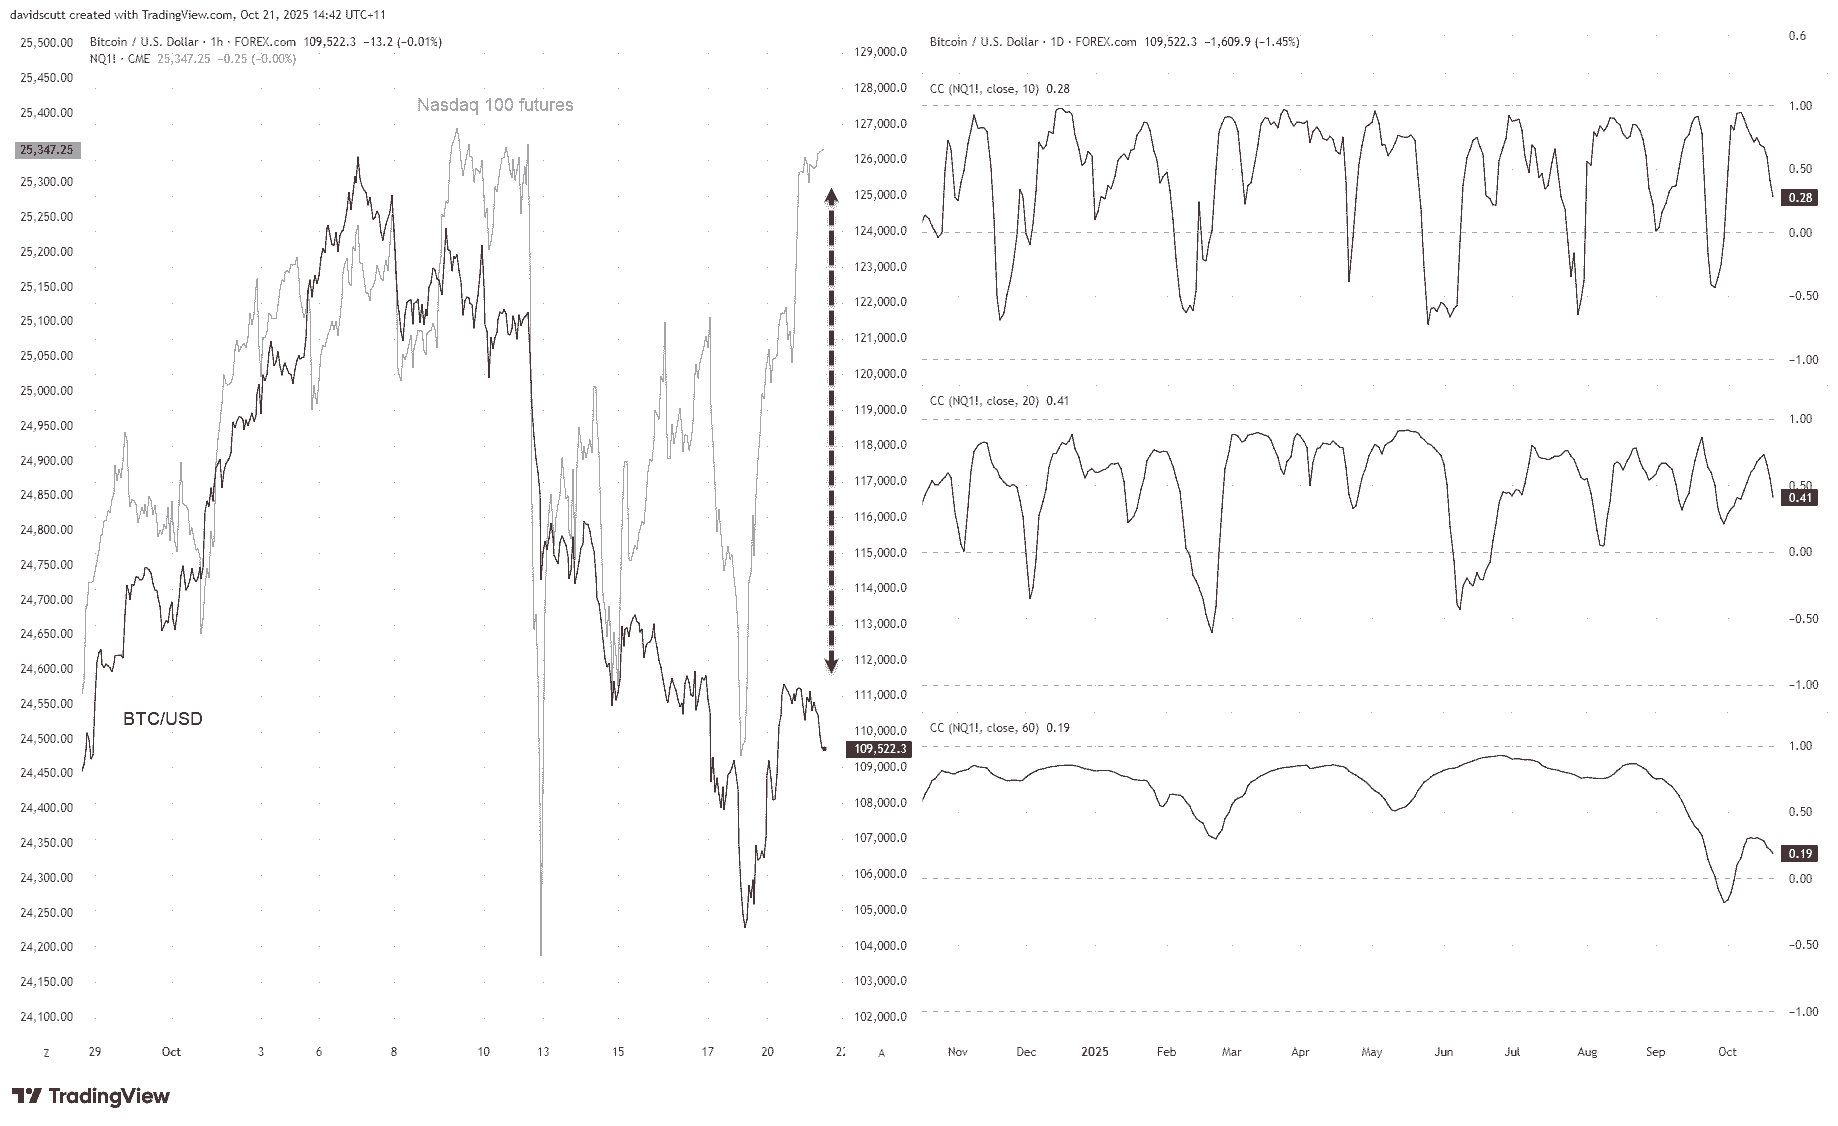
That’s evident in the chart above, with the right-hand pane tracking the rolling correlation Bitcoin has seen with Nasdaq 100 futures over the past 10, 20, and 60 days. At 0.28, 0.41, and 0.19 respectively, the strength of the relationship sits somewhere between weak to nonexistent—an unusual development compared to the coefficient scores registered over the same timeframes earlier this year.
Bitcoin is doing its own thing, and right now that’s struggling while other risk assets surge.

BTC/USD Technical Analysis
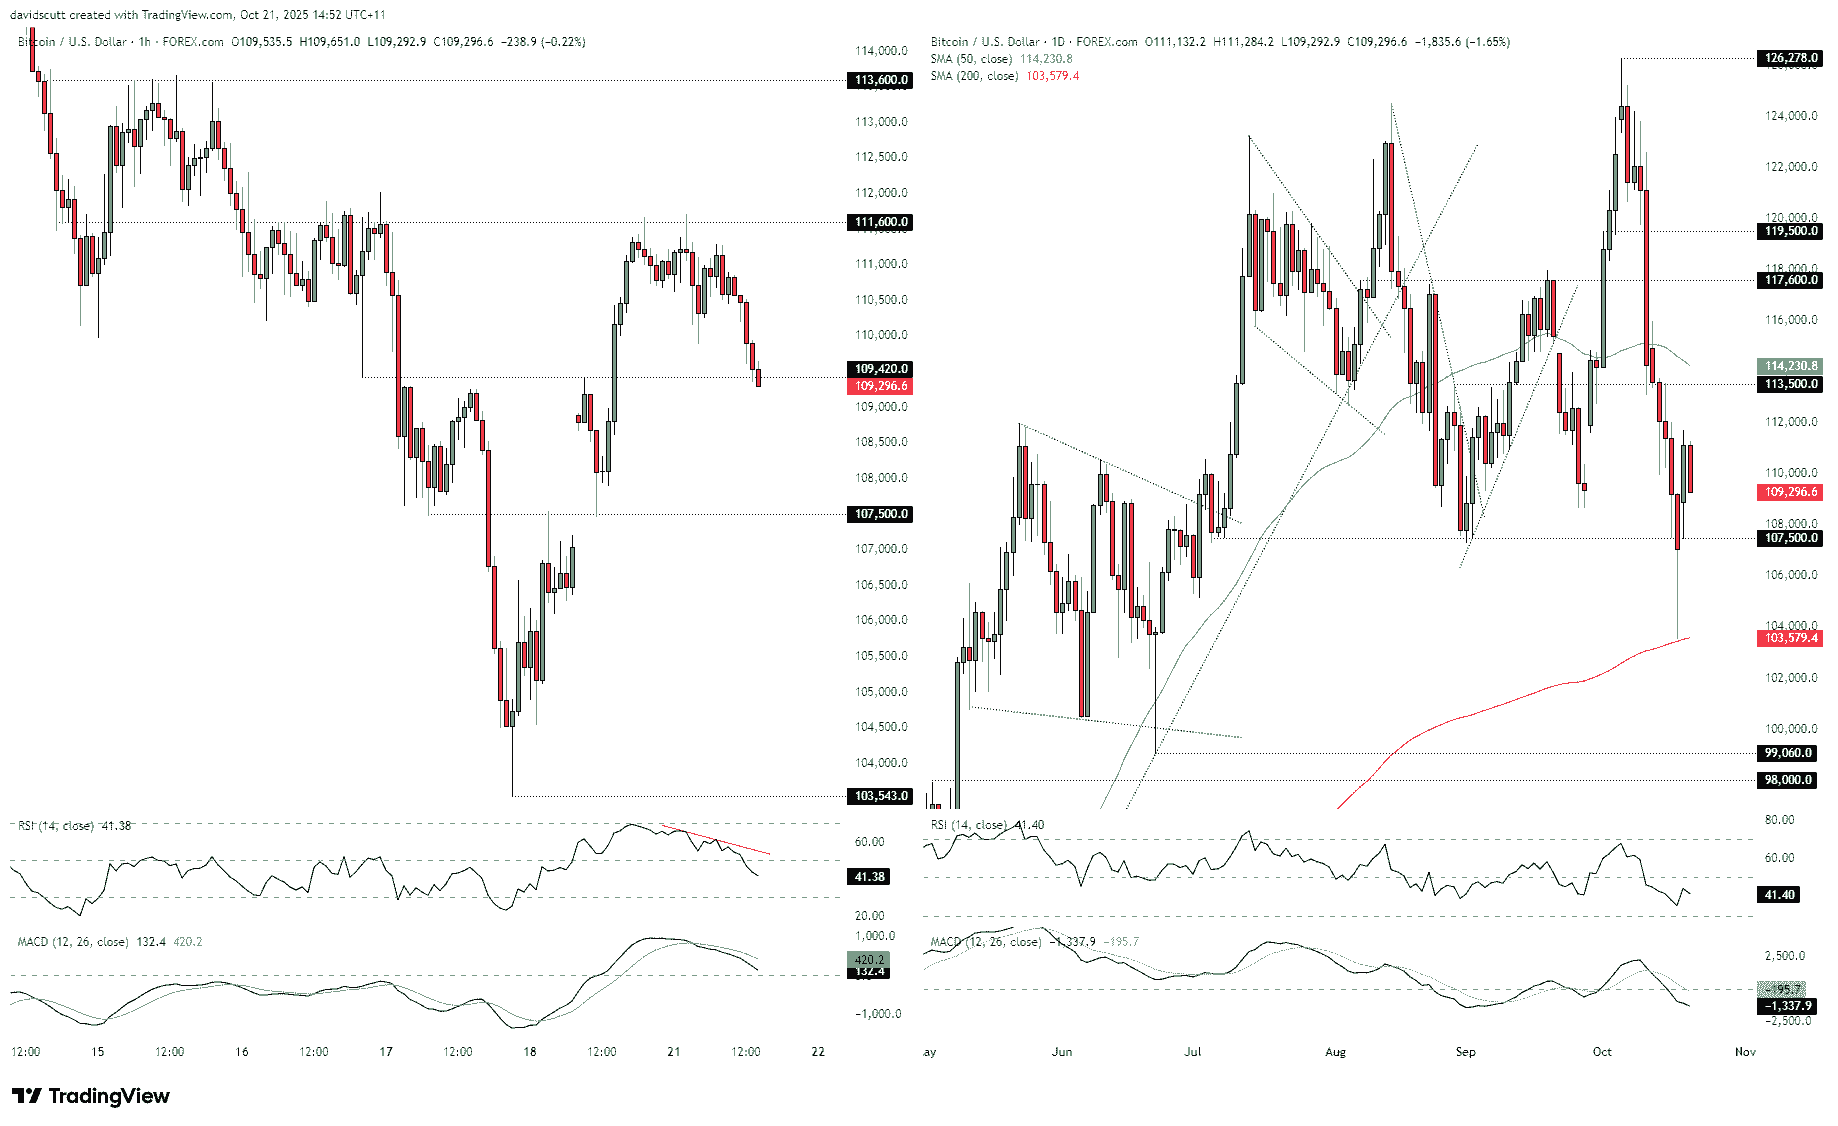
The following chart is broken into two panes. On the left, we have BTC/USD using an hourly tick with the daily on the right, providing levels that can be used to evaluate setups over both short and longer-term time horizons.
Source: TradingView
On the hourly tick, you can see the price has broken below $109,420, a level it tagged on multiple occasions earlier this month before reversing. With RSI (14) trending lower below 50, bearish momentum is picking up steam after twin failures at $111,600 on Monday. MACD has yet to confirm but has already crossed the signal line from above and is now moving closer to negative territory. The overall assessment is therefore mildly bearish, favouring downside near term.
Should the price remain beneath $109,420, shorts could be established with a stop above the level for protection, targeting $107,500, which is another level the price has tagged on multiple occasions before reversing over recent weeks. If the price were to reverse back above $109,420 and hold there, the setup could be flipped with longs established above with a stop beneath, targeting either $110,000 or $111,600.
Turning to the daily timeframe, the momentum picture is outright bearish with RSI (14) below 50 while MACD has turned negative having already crossed the signal line from above. Again, that favours downside over upside over slightly longer timeframes.
With the price sliding lower again, the importance of $107,500 is reinforced by recent price action at the level, often sparking significant bounces or reversals after trading through it, including late last week. Below, the significant reversal from the 200-day moving average last Friday ensures it’s a key level to watch should we see another move beneath $107,500.
On the topside, Monday’s bounce stalled around $111,600, making it the first level of note. $113,500 and the 50-day moving average are others that should also be on the radar.