EUR/USD – Potential push down towards minor range support

click to enlarge chart
- The pair has pushed up towards the upper limit of the short-term neutrality range at 1.1310 as it printed a high of 1.1284 yesterday, 15 Jul. Recalled that we have turned neutral in our previous report due to mix elements (click here for a recap).
- Right now, key elements have indicated signs of a potential short-term bearish reversal at this juncture where the price action of the pair has formed a daily bearish “Shooting Star” candlestick pattern at the end of yesterday, 15 Jul U.S. session right below the pull-back resistance of a former minor ascending support from 30 May 2019 low and the medium-term descending resistance from 10 Jan 2019 high.
- Flip back to a bearish bias below 1.1310 key short-term pivotal resistance for a potential push down to target 1.1210 follow by the 1.1180 minor range support. However, a break with an hourly close above 1.1310 negates the bearish tone for a squeeze up to retest the 25 Jun swing high of 1.1410.
GBP/USD – Bears remain in control
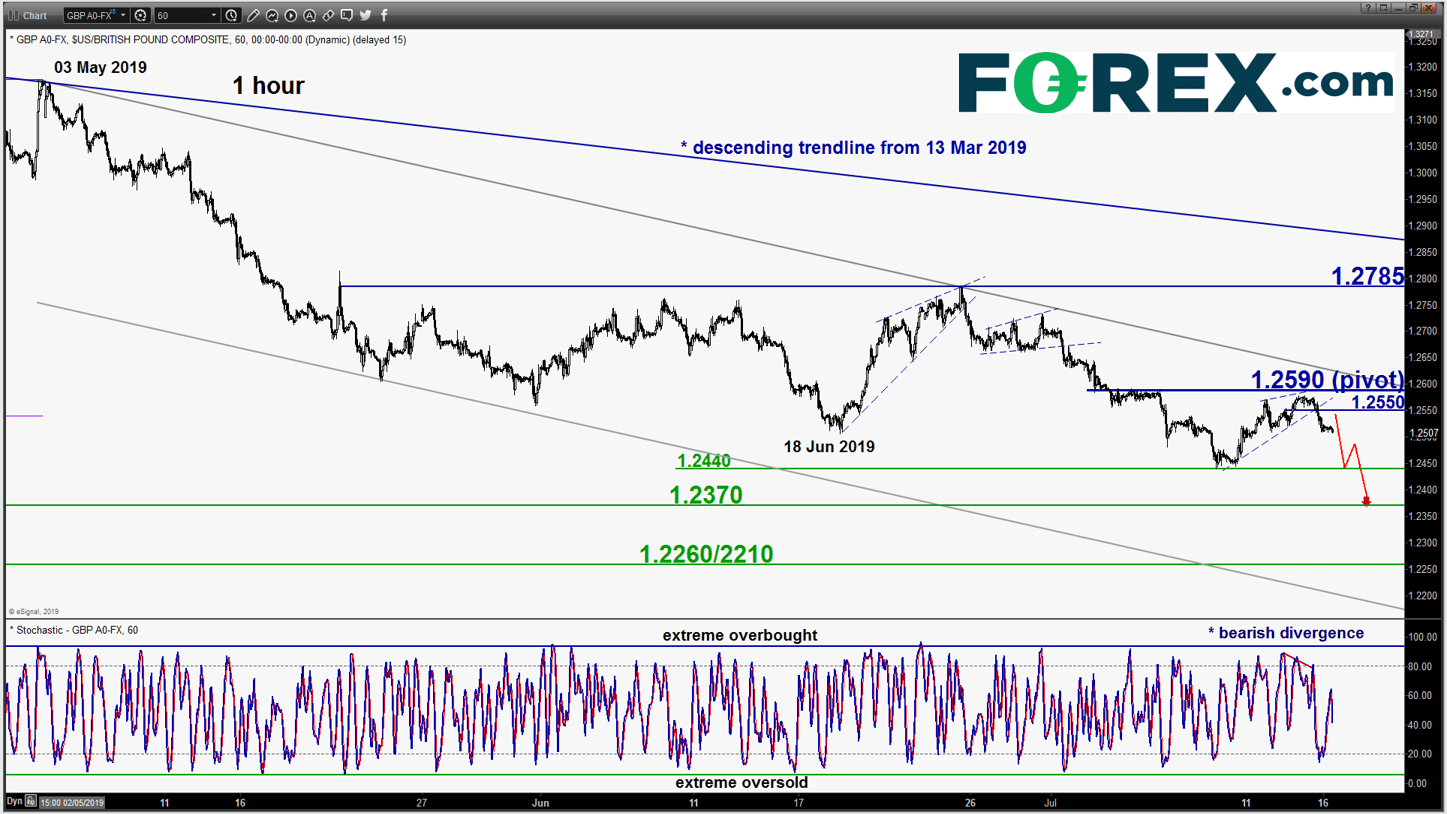
click to enlarge chart
- Yesterday’s push up in price action has managed to stall right below the 1.2590 key short-term pivotal resistance as per highlighted in our previous report (printed a high of 1.2580).
- The bounce in price action from last week’s low has formed a bearish minor “Ascending Wedge” and yesterday’s price action has broken below its support coupled with a prior bearish divergence seen in the hourly Stochastic oscillator at its overbought region. Maintain bearish bias for a further potential push down to retest last week’s swing low at 1.2440 before targeting the next near-term support at 1.2370 (06 Apr 2017 low & Fibonacci projection).
- However, a break with an hourly close above 1.2590 negates the bearish tone for an extension of the corrective rebound towards the next resistance at 1.2785.
USD/JPY – Further drop in progress

click to enlarge chart
- Last Fri, 12 Jul Asian session, the pair has push up to test the 108.60 key short-term pivotal resistance highlighted in our previous report (without an hourly close above it) before it reversed down as expected.
- Maintain bearish bias in any bounces below 108.60 key short-term pivotal resistance for a further potential push down to target the near-term supports of 107.55 and 107.10.
- However, a break with an hourly close above 108.60 negates the bearish tone again for a squeeze up to retest the 109.00 key medium-term resistance.

click to enlarge chart
- The pair has broken above the 0.7000 key short-term pivotal resistance and drifted up to test the 0.7040/50 key medium-term resistance (also the descending trendline from 03 Dec 2018 high).
- Bullish exhaustion elements have been sighted as this juncture; the bounce from 12 Jul 2019 low has evolved into a minor “Ascending Wedge” range configuration coupled with a bearish divergence signal seen in the hourly RSI oscillator at its overbought region.Maintain bearish bias with 0.7040/50 as the pivotal resistance and an hourly close below 0.7025 reinforces a potential push down to retest 0.6965 before targeting the minor range support of 0.6900.
- However, a clearance with a daily close above 0.7050 invalidates the medium-term down move sequence in place since 03 Dec 2018 high for a further recovery towards the next intermediate resistance at 0.7130.
Charts are from eSignal