View related analysis:
- Tentative Signs of a US Dollar Rebound Ahead of Powell speech
- US Dollar Index, USD/CAD, AUD/CAD Analysis
- EUR/USD, AUD/USD, S&P 500 Analysis: COT Report
- AUD/USD Stages a V-Bottom Recovery
Australian Dollar (AUD/USD) Technical Analysis
The V-bottom on the Australian dollar’s daily chart is undeniably impressive—though perhaps not quite as striking as the one seen on the New Zealand dollar (NZD/USD). The sharp rally, coupled with a false break below the 0.60 level, suggests AUD/USD may have printed a significant low that could eventually lead to further upside.
That said, the 0.64 level has been a formidable barrier for bulls throughout the year, repeatedly capping rallies. A long-term 38.2% Fibonacci level and 200-day EMA also sit just above 64c. Furthermore, a bearish pinbar has formed just below 0.64 on the daily chart, reinforcing it as a strong area of resistance. And this suggests the rally could be becoming exhausted over the near term.
Given the potential for a short-term bounce in the U.S. dollar before further downside resumes, my bias for AUD/USD is for a retracement lower before any eventual break above 0.64.
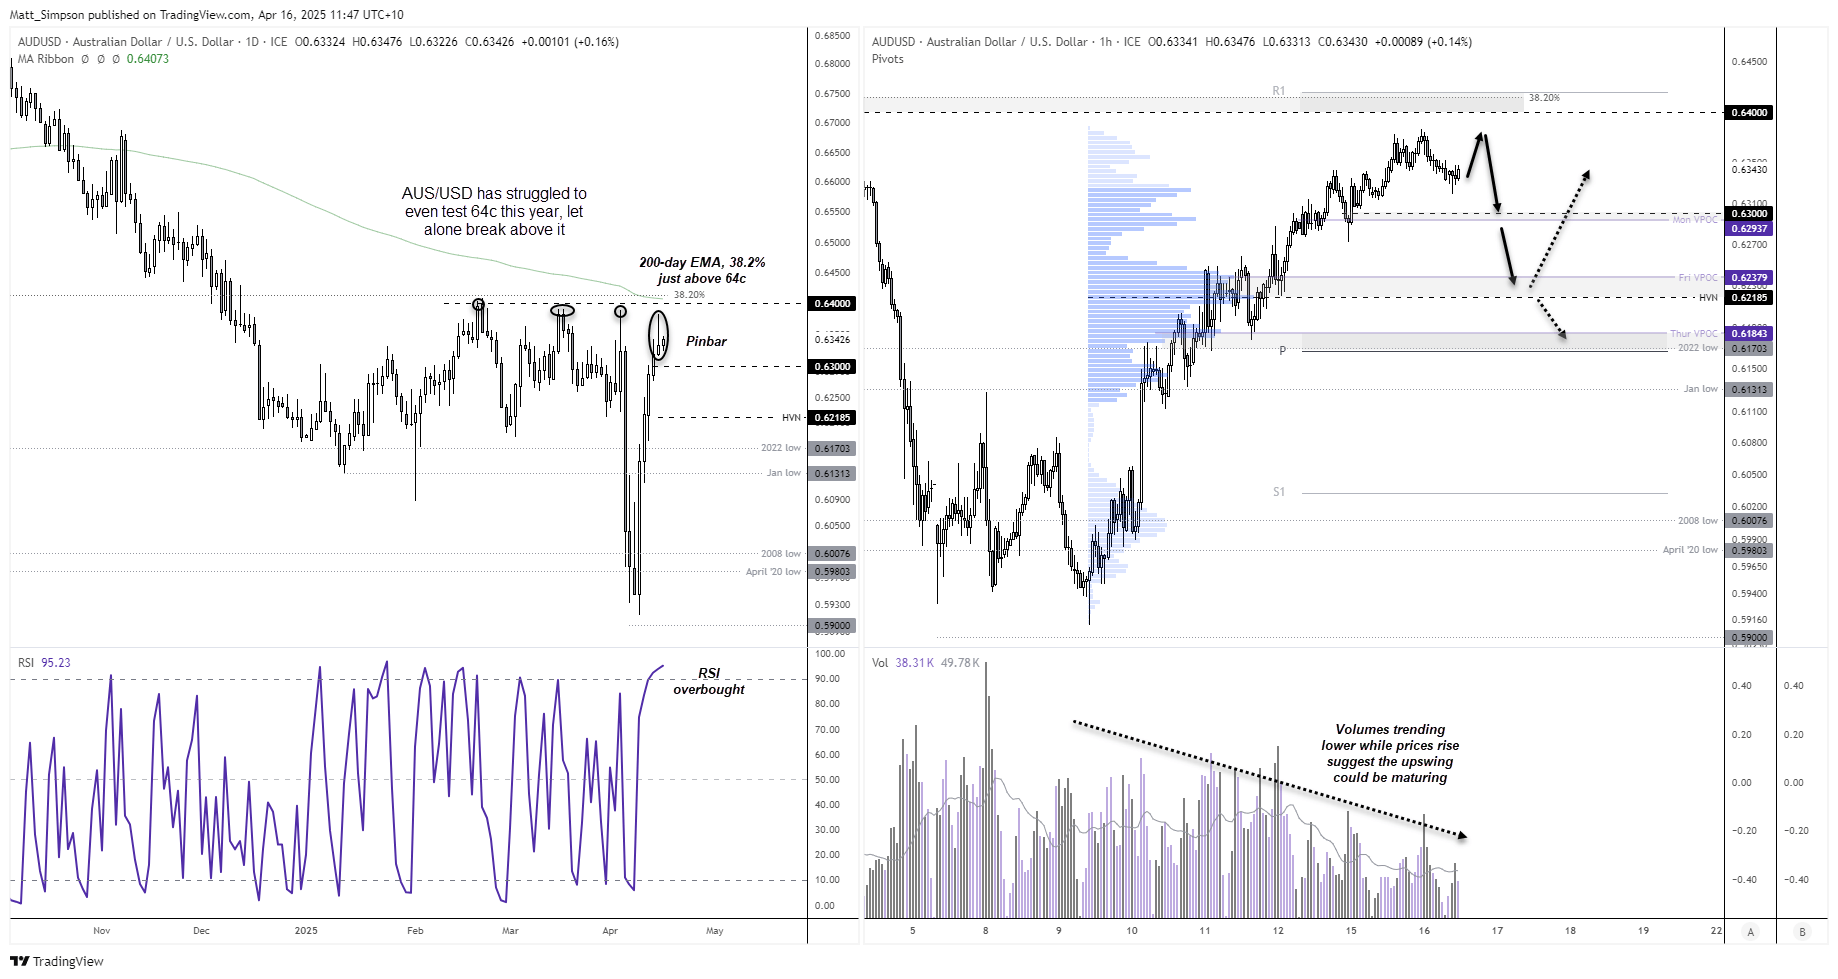
The 1-hour chart shows prices have been rising while volumes declined, again suggest the rally could be maturing. For now, AUD/USD is trying to form a swing low. But I suspect bears will be seeking to fade into moves towards 64c.
Note the potential support cluster around 0.6200, 0.6218 – 0.6280 and 0.6170 – 0.6184 that could be targeted by bears.

British Pound (GBP/USD) Technical Analysis
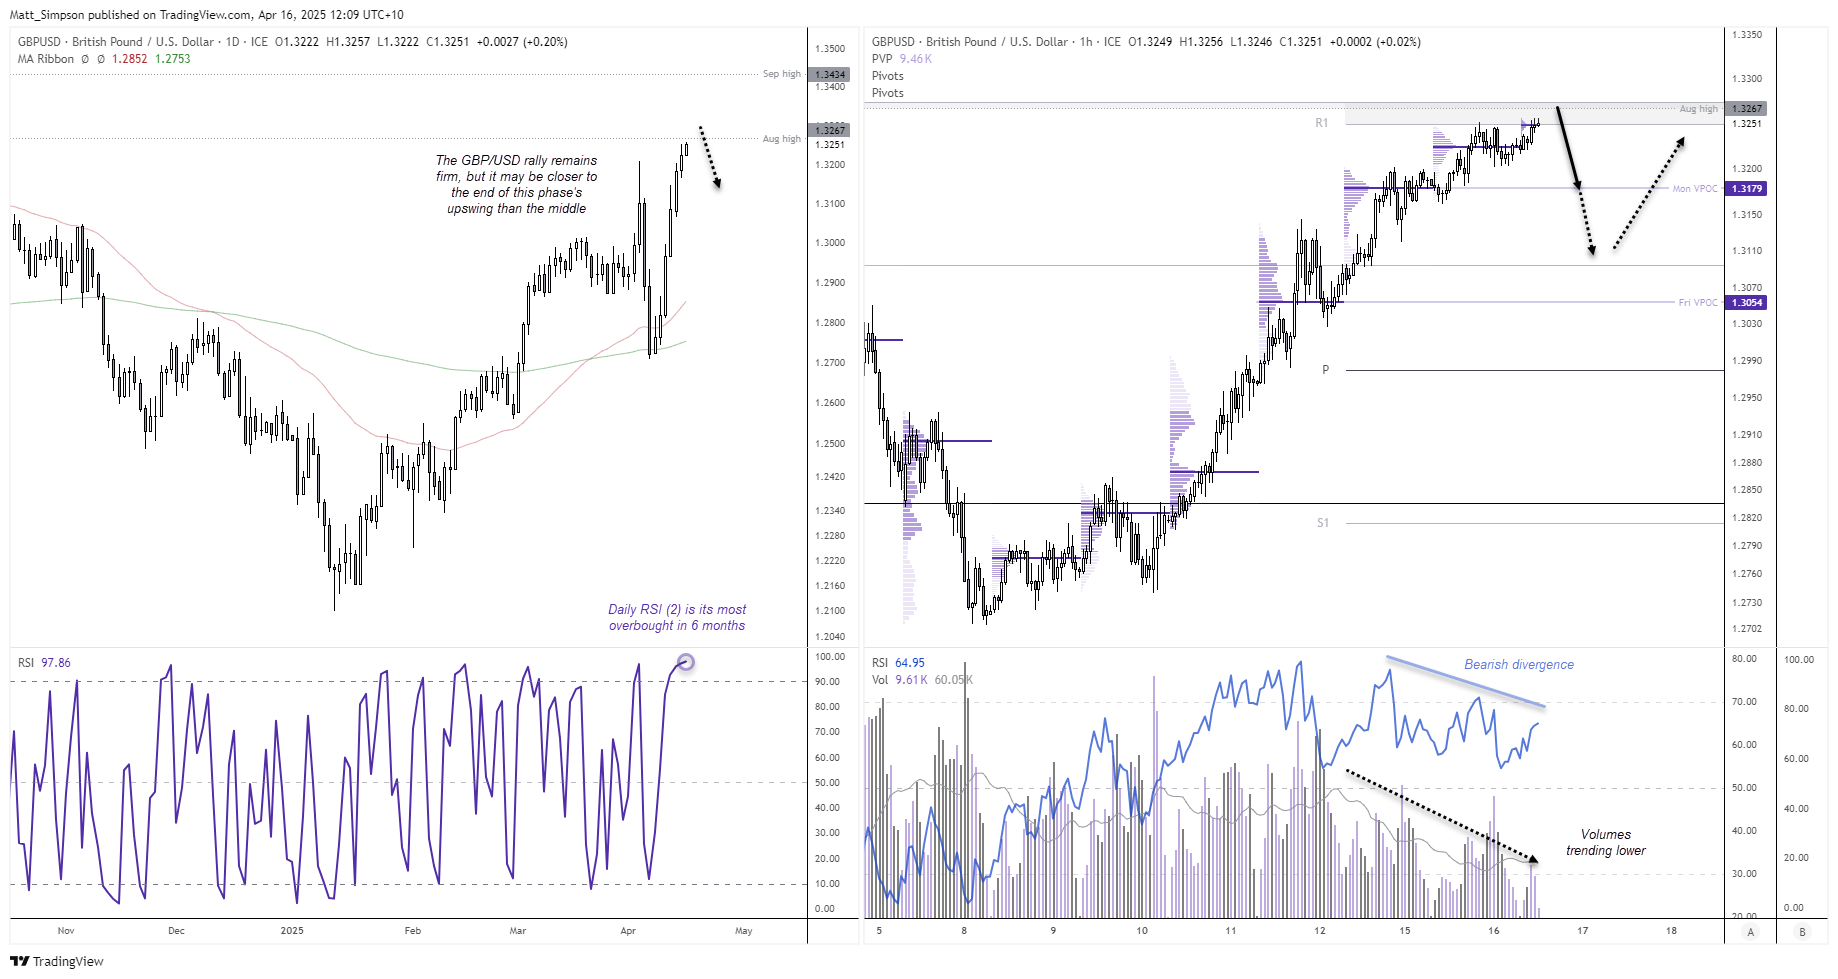
GBP/USD has risen 10% since the January low and, like EUR/USD and NZD/USD, also trades above its April 3rd high. Having wracked up six consecutive days and gunning for a seventh during today’s Asian session, not much stands in its way of further gains other than the August high (and the fact we’ve already witnessed a multi-day run).
However, the daily RSI (2) has risen to the extremely overbought level of 98.1 – its highest level since September. It is also in the overbought zone for a fourth day. And if we switch to the 1-hour chart, volumes are trending lower while prices rise, and the weekly R1 and monthly R2 pivots are in the area.
GBP/USD may appear as tantalising to bears as AUD/USD does over the near-term, but I am wary of being bullish on GBP/USD around these levels. Even if it continues higher, I suspect we’re closer to the end of this phase of the rally than the middle.
Bears could either target support zones around 1.3180 or 1.3050 – 1.310, or bulls could wait to see if such levels provide support for potential longs in future.

Canadian Dollar (USD/CAD) Technical Analysis
I outlined my near-term bullish bias on USD/CAD, though given recent developments I now see the potential for it to break above 1.4. Softer-than-expected inflation figures for Canada weakened the Canadian dollar on renewed bets of a Bank of Canada (BOC) cut tomorrow, and send USD/CAD higher accordingly.
A Morning Star reversal pattern formed at tight support zone around 1.3820, comprising of the September VPOC and November low. My near-term bullish bias is for a move up to the 200-day EMA (1.0466) or 1.4100 handle.
The 1-hour chart shows prices are retreating from the 2022 high, though the move appears to be corrective. Bulls could seek dips down to the monthly S3 pivot (1.3922), near Mondays doji high, in anticipation of a breakout above 1.40 en route to the 200-day EMA or 1.41 handle.

-- Written by Matt Simpson
Follow Matt on Twitter @cLeverEdge