
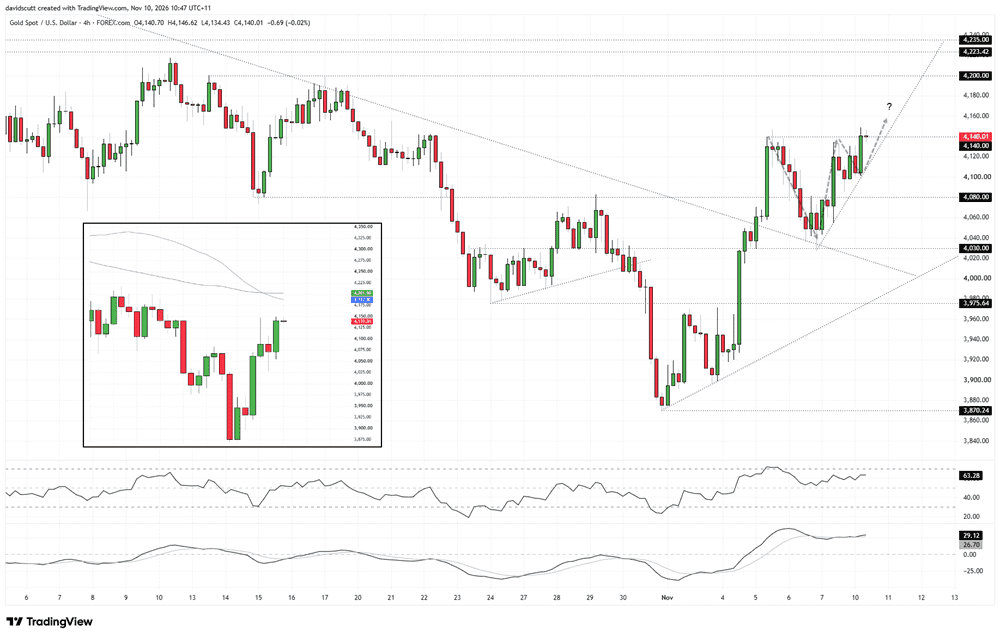
- Gold coils beneath $4,140 triangle resistance
- Pre-CPI volatility historically lower than normal
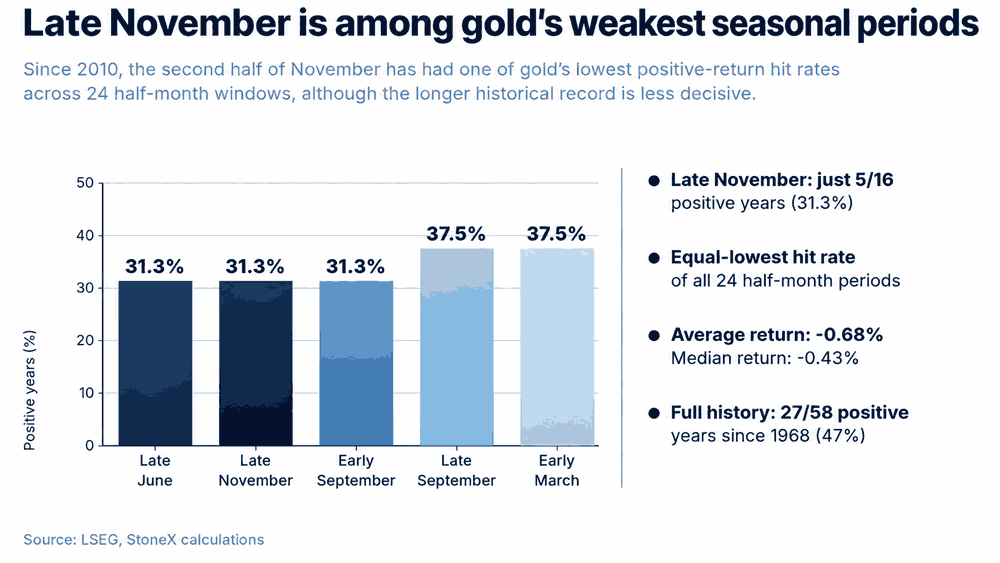
- Late November among weakest seasonal periods
Gold is coiling in what resembles an ascending triangle on the four-hourly chart ahead of tonight's US CPI report, with rising lows putting the price within touching distance of resistance around $4,140.
With gold showing little consistent relationship with traditional drivers such as the US dollar and Treasury yields recently, it may be worthwhile putting more weight on technicals than fundamentals when assessing where the price may move next.
Gold volatility around US CPI
In recent years, gold has been less volatile ahead of US CPI reports than on other trading days. Historical analysis of hourly price action since 2023 reveals that the average absolute move in the six hours preceding inflation reports has been just 0.23%, compared with 0.35% during equivalent periods on non-CPI days, approximately 35% less movement.
Perhaps surprisingly, CPI days haven't necessarily delivered larger daily moves either. Since 2022, gold's average absolute close-to-close change on CPI days has been 0.81%, slightly below the 0.85% recorded on other sessions. There's also no reliable directional bias to hang one’s hat on either.
Late November seasonality
While tonight's US inflation report carries the potential to trigger substantial knee-jerk reactions, especially if the core print deviates significantly from market expectations, one thing traders should be mindful of when assessing gold setups heading further into November is its relatively recent tendency to underperform in the second half of the month.
Source: LSEG
Since 2010, gold has risen during the second half of November on just five of 16 occasions, an equal-lowest positive hit rate among all 24 half-month periods of the year. The average return over that window has been -0.68%.
Over the full sample since 1968, however, the positive hit rate rises to 47%. I wouldn't trade on this seasonal pattern alone, but it's something to be aware of.
Gold ascending triangle approaches decision point
Source: TradingView
On the four-hourly chart, $4,140 remains the line in the sand for bulls, having capped the price on several occasions earlier this month. The latest pullback leaves the ascending triangle formation intact, with minor uptrend support running from the November 6 lows providing the lower boundary.
While RSI (14) is yet to set a higher high, it continues to sit above the neutral 50 level, indicating that upside momentum remains in the ascendancy. MACD supports that view, having staged a bullish crossover and moved into positive territory. Neither indicator points to a rapid increase in upside pressure, although that could change if a successful breakout takes place.
If the price breaks above $4,140 and sticks, preferably followed by a backtest and bounce, longs could be initiated with a tight stop beneath the level for protection. The first upside target sits around $4,188, where the 50-day moving average is located, followed by resistance at $4,200, which runs almost parallel to the 100-day moving average, currently around $4,202, as shown in the daily chart inset. A break above that resistance zone would bring $4,223.42 and $4,235 into play.
Conversely, a break beneath the minor uptrend support running from the November 6 lows would bring the bullish setup into question, putting $4,080 and potentially $4,030 into focus.