
- Fed decision and dot plot are the key risk for USD/JPY
- 25bp cut expected, but tone, vote split and dots will drive reaction
- Hawkish cut risks upside, dovish dots could sink the dollar
- Technical picture neutral, leaving price action to guide direction
USD/JPY Summary
USD/JPY enters a critical week dominated by the Fed. While Japanese yields have influenced recent moves, that theme takes a back seat to Wednesday’s FOMC decision. A 25bp cut is widely expected, but the real volatility trigger will be the statement, vote split and updated dot plot. With technical signals offering no clear bias, Powell’s tone could tip the scales, setting up a decisive move for the pair.
BOJ Speculation Is Moving the Yen
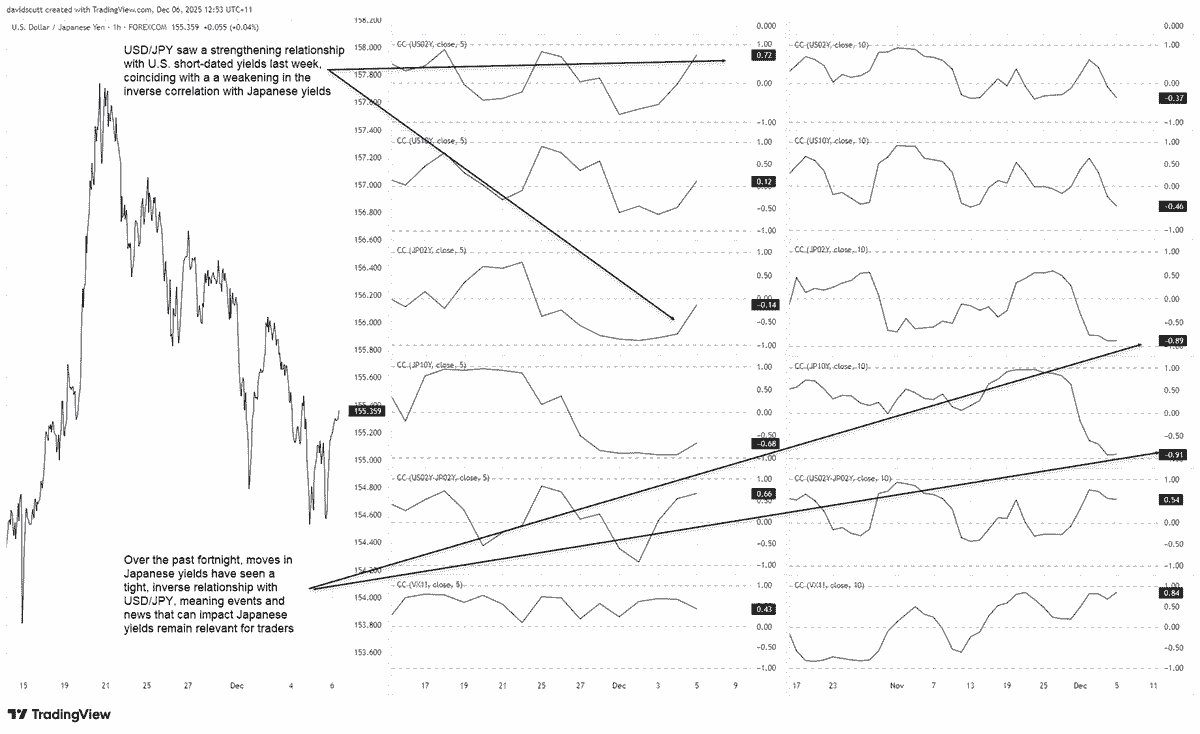
What’s noticeable in the five and 10-day correlation coefficients in the middle and right-hand panes of the graphic below is that USD/JPY has had a far stronger relationship with Japanese bond yields recently, flipping the script on what is usually seen, where it’s the U.S. rate outlook that tends to influence direction.
Source: TradingView
For large parts of November, USD/JPY and Japanese rates were positively correlated, with higher yields driven by increased fiscal spending contributing to weakness in the yen, presumably on concerns about servicing Japan’s enormous debt load. However, over recent weeks the relationship has flipped entirely, with a tight inverse relationship now evident. Higher yields driven by speculation over a rate hike from the Bank of Japan on 19 December now seem to be supporting the yen.
Over the past fortnight, the correlation coefficient between USD/JPY and Japanese two and 10-year bond yields sit at -0.89 and -0.91 respectively, far stronger than anything seen with yield spreads, U.S. yields or volatility measures such as VIX futures over the same period. That means for USD/JPY traders, the week is not just about what the Fed does. Events that influence Japanese bond yields could easily impact the yen.
But Fed May Flip the Script
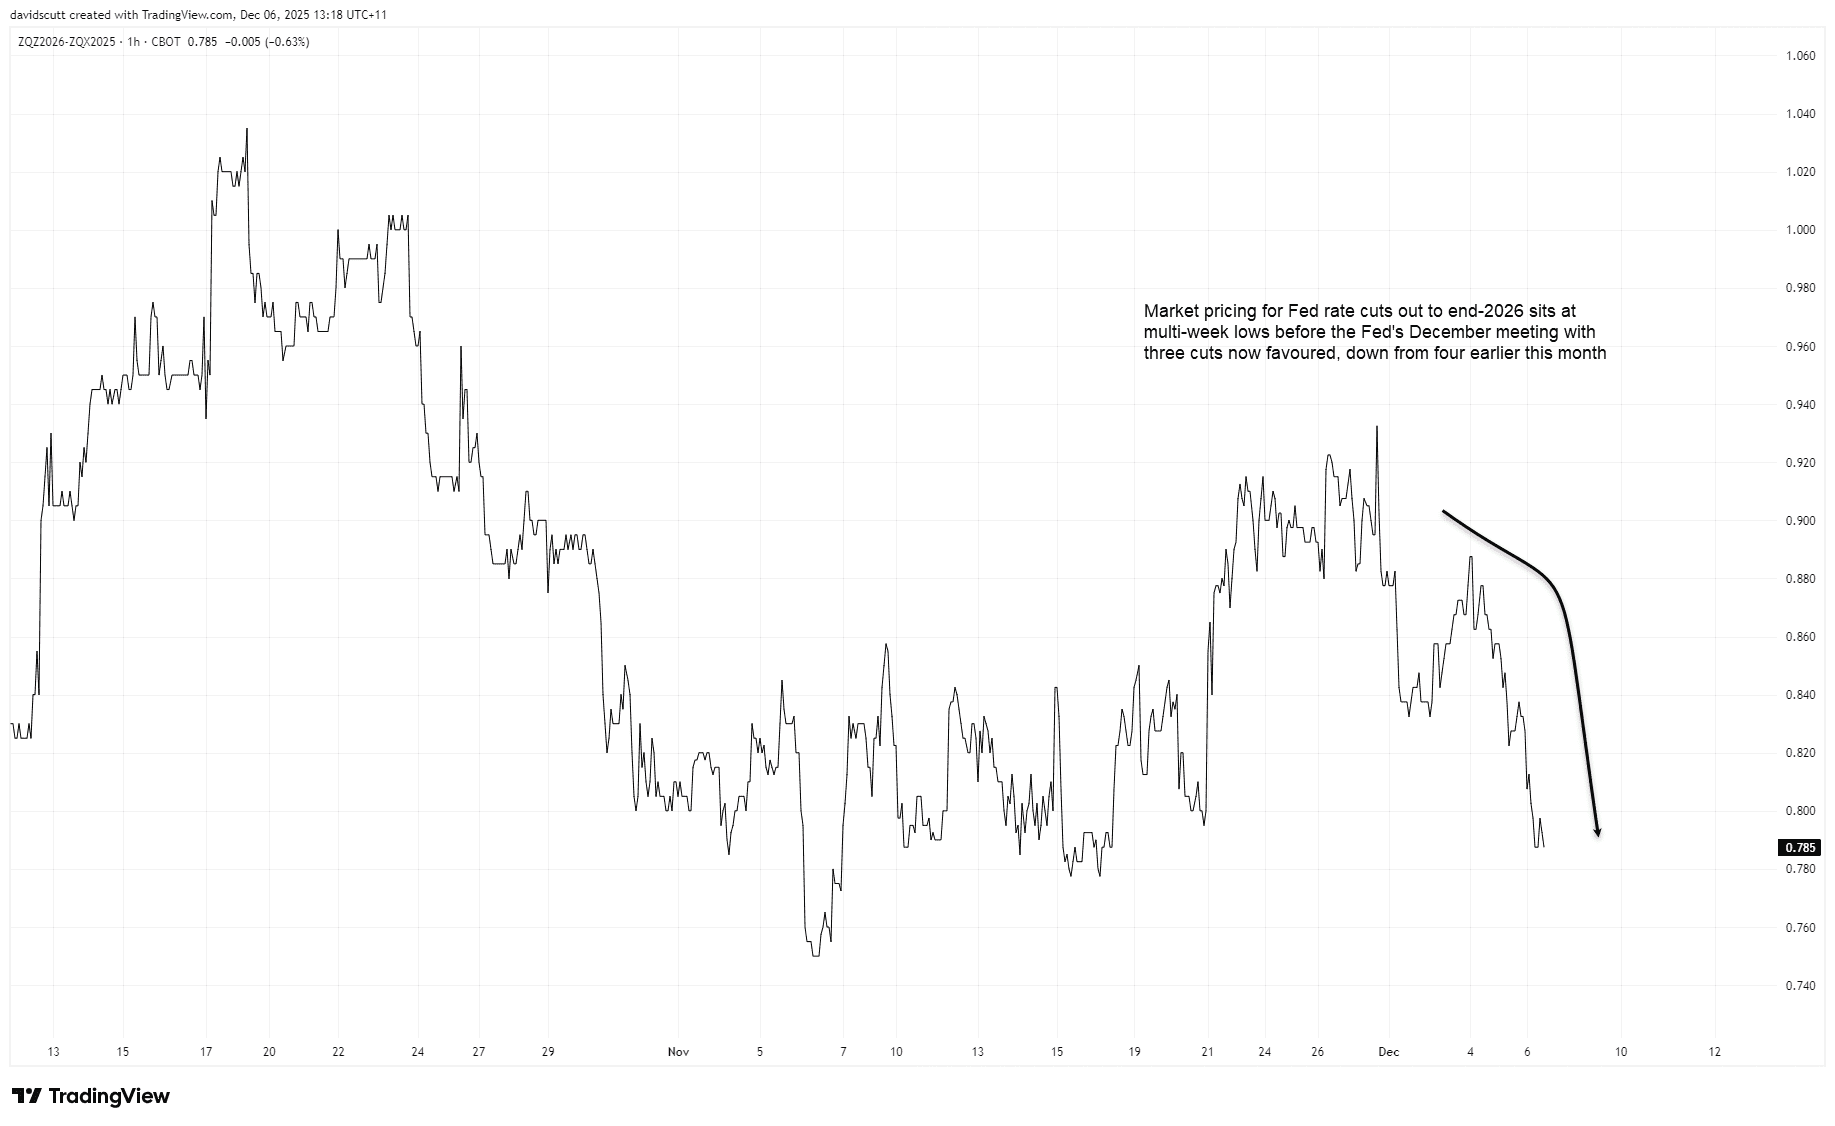
Zooming in, while the relationship between USD/JPY and Japanese yields remains intact, the strength weakened a touch over the latter part of last week, replaced by a strengthening relationship with short-end U.S. interest rates, which are heavily influenced by monetary policy expectations from the Fed. That was evident on Friday, where pricing for Fed rate cuts out to the end of next year skidded to just 78.5 basis points of easing, down from over 90 basis points at the start of December. That coincided with a meaningful bounce in USD/JPY, underlining that the key event for USD/JPY traders will be the FOMC decision on Wednesday.
Source: TradingView

Dots, Dissents and Powell
Unless the Fed stuns markets by doing something other than reducing the funds rate by 25 basis points to a range of 3.5 to 3.75% as is favoured, what’s likely to drive the rates reaction and USD/JPY is what the Fed offers in terms of forward guidance on the policy path moving forward.
Clues may be found in the statement, both through wording and the vote split for and against the decision. As was the case last meeting, Stephen Miran will likely vote for a 50 basis point cut, but that should not come as a surprise. What will be more interesting is how many members vote to keep policy unchanged. There was one dissenting member last meeting, and there may well be more on Wednesday given the vastly differing opinions offered by members prior to the Fed’s media blackout.
The perception is the FOMC is divided between inflation hawks and labour market doves, so that’s what will be expected. What would likely deliver a meaningful market reaction would be if the vast majority of the committee vote in favour of a 25-point reduction, likely bolstering pricing for rate cuts next year and weighing on USD/JPY.
Beyond the statement, it will be all about what the updated dot plot of individual year-end rate forecasts shows, along with the tone from Jerome Powell at his post-meeting press conference which will likely guide USD/JPY direction.
Source: Federal Reserve
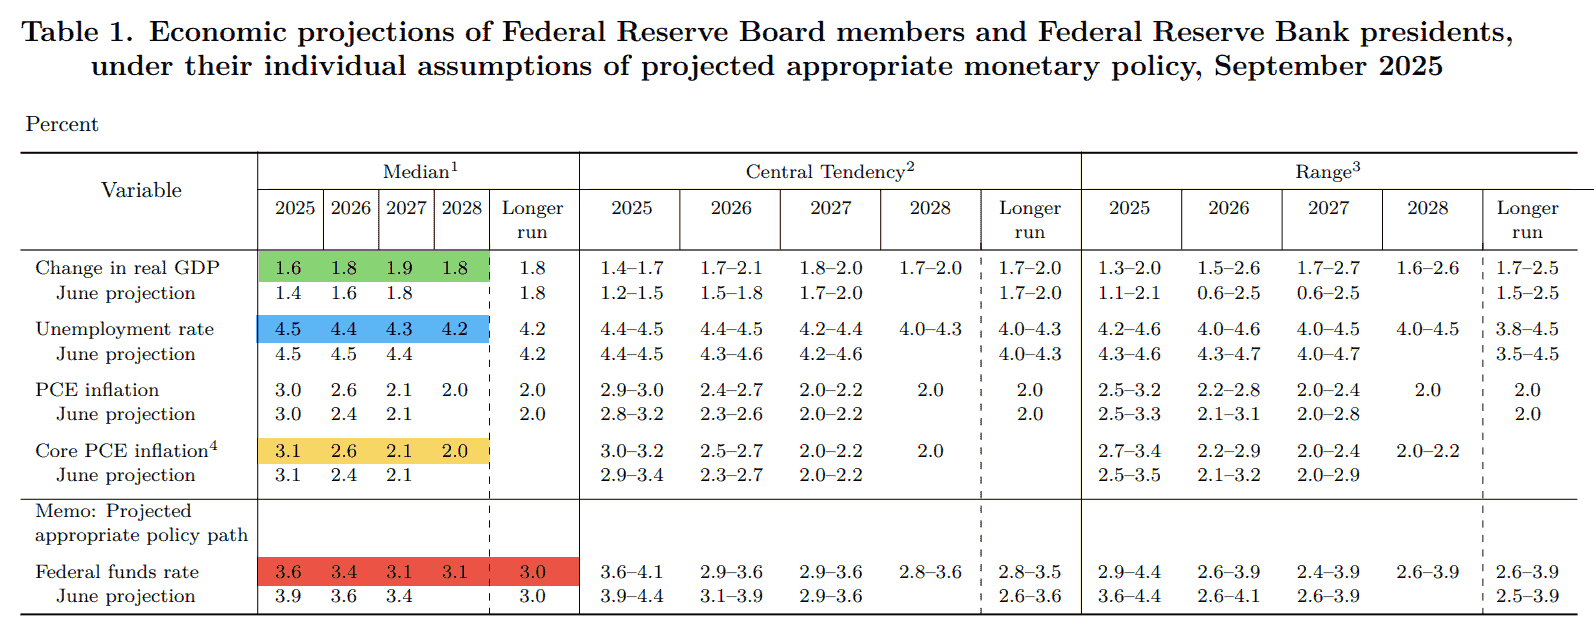
When it comes to forecasts, often referred to as “the dots”, the projections from three months ago are shown in the red shading above. Back then, the median member forecast saw two remaining cuts in 2025, with one more in each of 2026 and 2027. Should the Fed reduce the funds rate by 25 basis points as is favoured by most traders and economists, it will mean they ended up delivering three cuts this year, potentially increasing the risk that fewer cuts may be priced for 2026 and 2027. That’s why some expect a “hawkish” cut from the Fed. But if the 2026 or 2027 profile has the same number of cuts as three months ago or more, and a lower long-run dot which essentially tracks the level where policy rates are neutral for economic activity, it will may be perceived as dovish, weighing on the U.S. dollar as a consequence. So the dots are very important.
There will also be a lot of commentary on the Fed’s updated forecasts for GDP growth, unemployment and the core PCE deflator, its preferred underlying inflation measure. Those from September are shown in green, blue and yellow respectively. My experience is that while these receive ample attention and spark debate, it’s the dots where the broader messaging on the implications is communicated to markets.
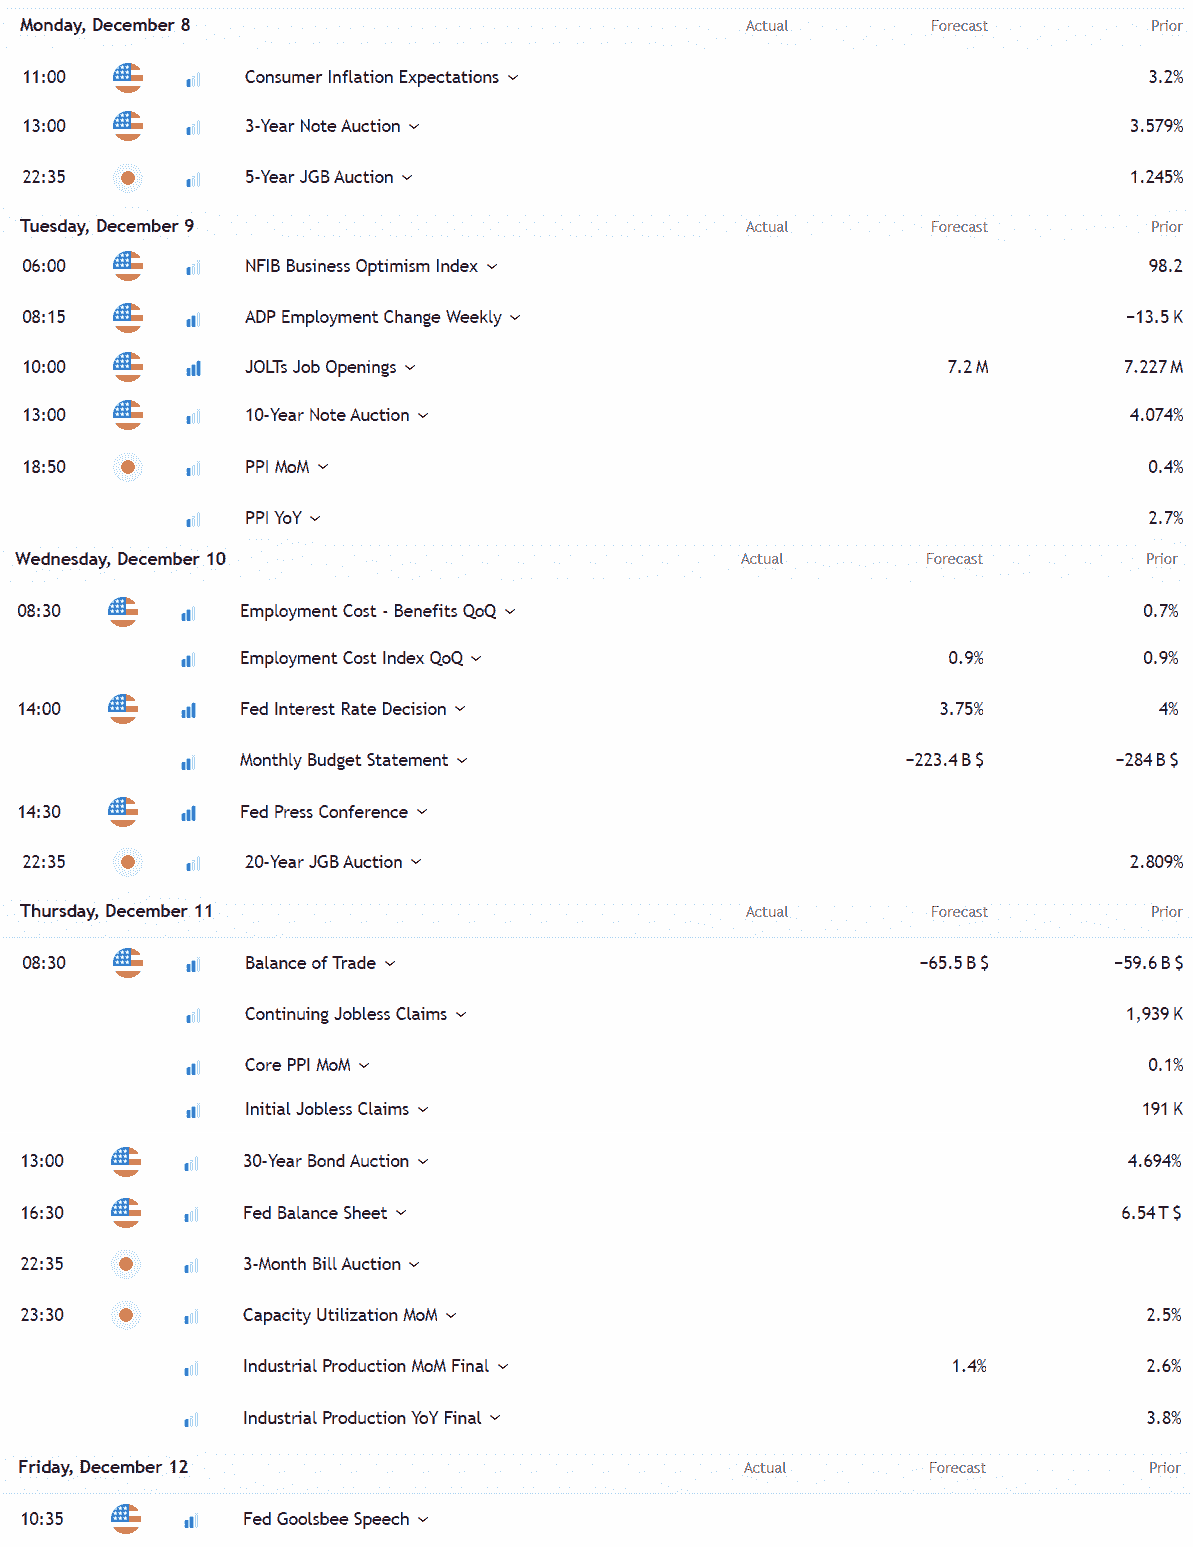
The remainder of the events calendar is found below with U.S. Eastern times shown.
Bond Auctions, Jobs Data Create Event Risk
Source: TradingView
Outside of the FOMC meeting, it’s labour market data from the U.S. that carries the greatest risk of sparking volatility in USD/JPY, so the JOLTS, ADP, employee costs and jobless claims reports are the ones to watch. Weakness may result in a weaker dollar and vice versa if strong. Given the influence outright and yield spreads often have on USD/JPY, auctions of three, 10 and 30-year Treasuries, and a 20-year Japanese government bond (JGB) auction, also loom as important. What’s been seen over the past week with JGBs is that higher yields have prompted stronger auction results, which have acted to support the yen.
USD/JPY Technical Outlook: Neutral Bias Amid Mixed Signals
Source: TradingView
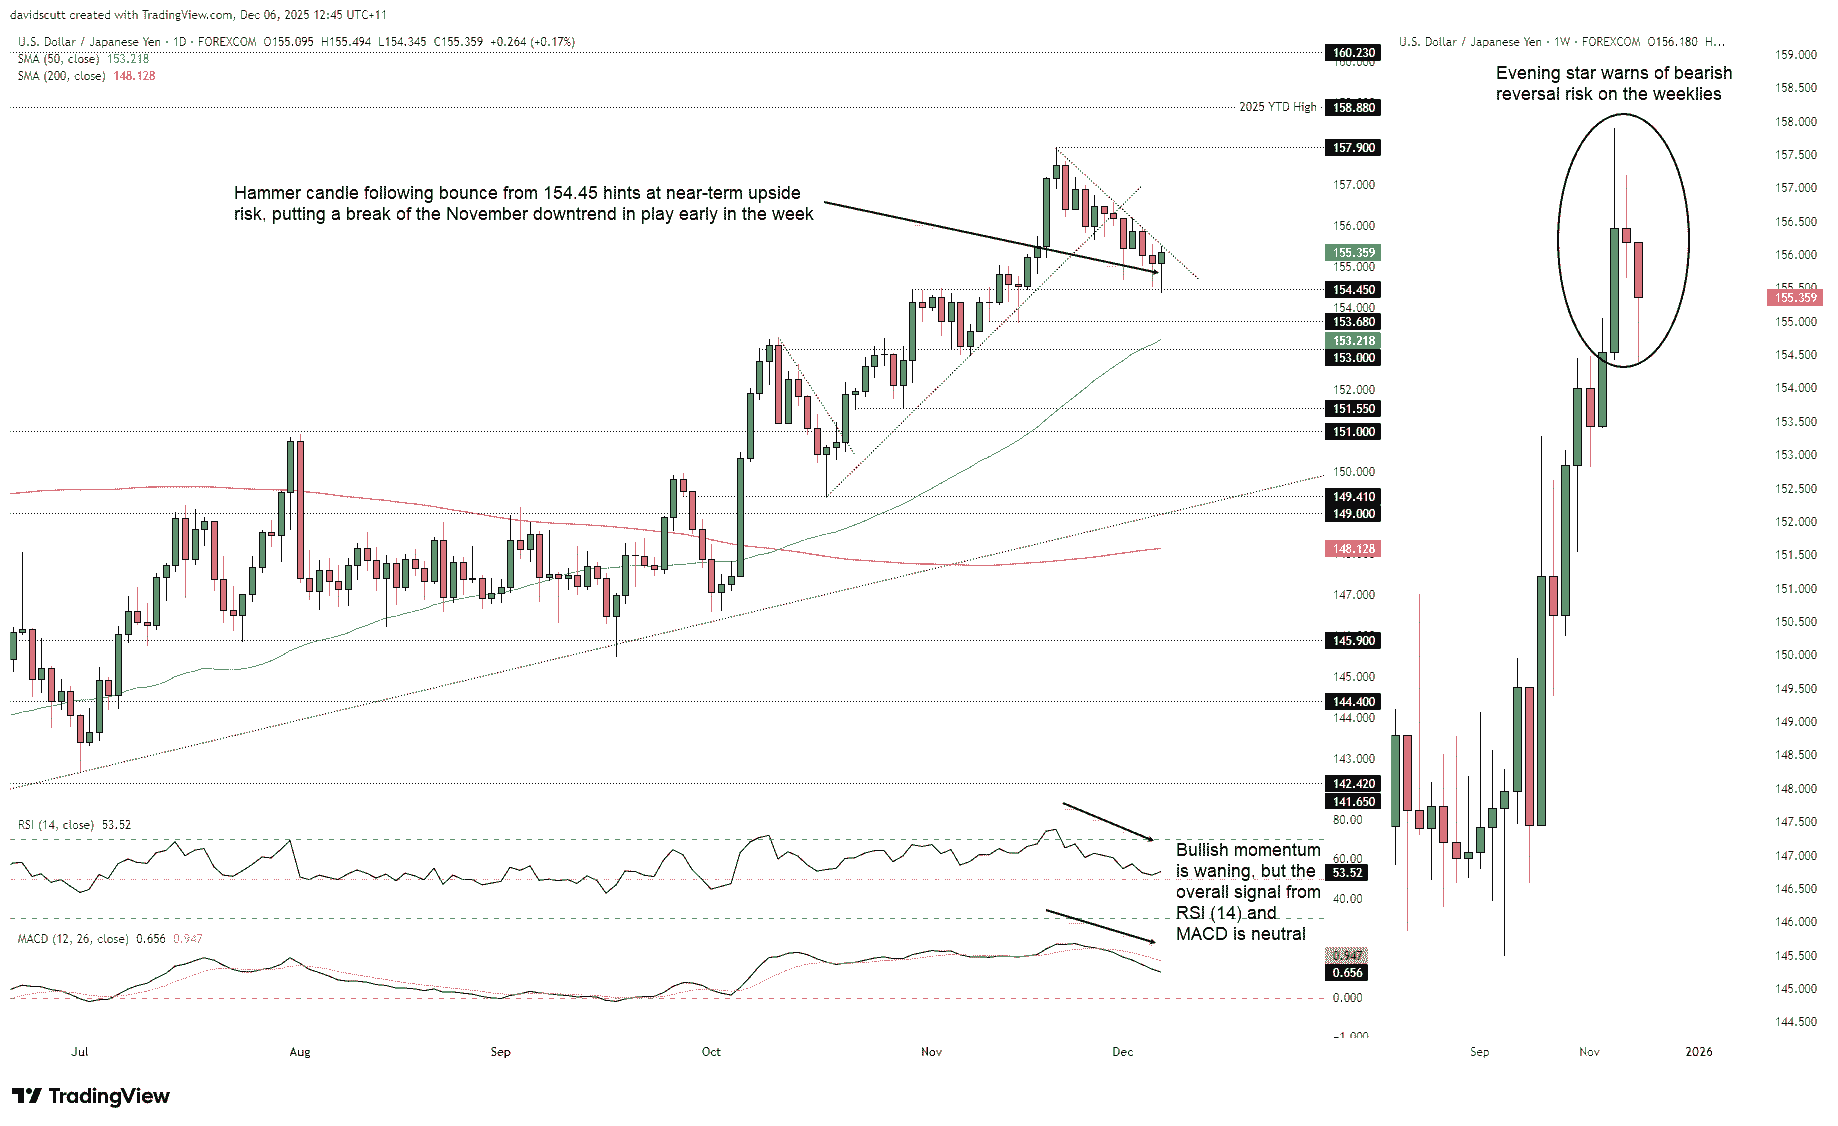
There are conflicting signals on the daily and weekly charts when it comes to directional risks, with the three-candle evening star bearish reversal pattern on the weeklies counted somewhat by Friday’s hammer candle, warning of near-term upside risk and potential break of the downtrend USD/JPY has been trading in over recent weeks.
The message from RSI (14) and MACD is one of waning upside pressure, with RSI (14) now sitting around neutral levels while MACD has crossed the signal line and is trending lower. The overall picture is neutral when it comes to directional bias, putting more emphasis on price action to assess the merits of individual setups.
Topside levels of note include the November swing high of 157.90 along with the big figures found in between. It the former were to be broken, bulls would likely target a retest of the 2025 high of 158.88.
On the downside, a break of 154.45 would bring the minor level of 153.68 into play, with more pronounced support found at 153.0. Price action around the 50DMA should also be monitored, although the pair tends to pay more attention to its 200-day equivalent. A dovish Fed would risk seeing those levels taken out, putting 151.55 and 151.00 support on the cards for bears.