
USD/JPY
USD/JPY continues to be a challenge for breakout traders as last week’s rally above the 150 handle has continued to pare back through this week, leading to a sequence of lower-lows and highs on the four-hour chart. Like the challenge of chasing on the upside, the quandary now is trying to avoid chasing the sell-off as the move has been unevenly distributed as shown by a building falling wedge formation. Sellers have so far shied away from the 150.00 level but as I showed in this week’s webinar, that’s a key spot of support potential for the pair, particularly after we saw such respect of the big figure back in September.
USD/JPY Four-Hour Price Chart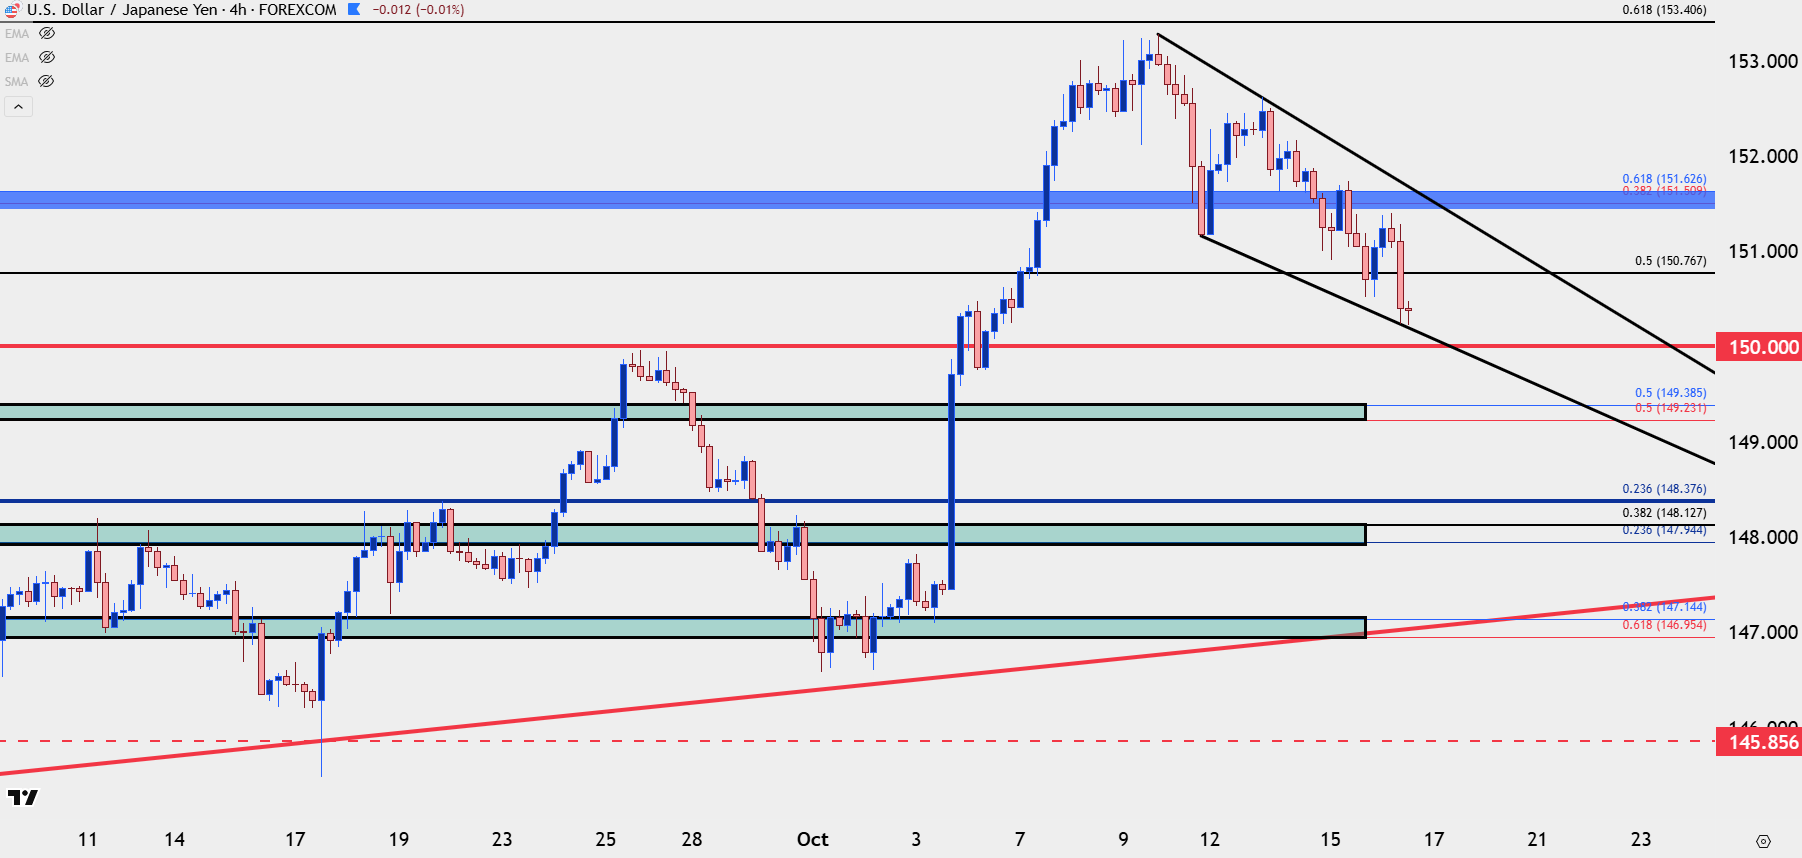
Chart prepared by James Stanley; data derived from Tradingview

USD/JPY Daily
The daily chart helps to illustrate where the rubber meets the road for USD/JPY as the prior breakout was massive, and we’re still pulling back from that. We’ve seen a 38.2% Fibonacci retracement of the rally from the September low, and the range leading into last week’s breakout had run for a little more than two months, so until bears are able to make a louder statement, this move looks corrective in the bigger picture. But, that said, I remain of the mind that Yen-weakness can be a more attractive variable elsewhere, as I’ll look at in EUR/JPY.
USD/JPY Daily Chart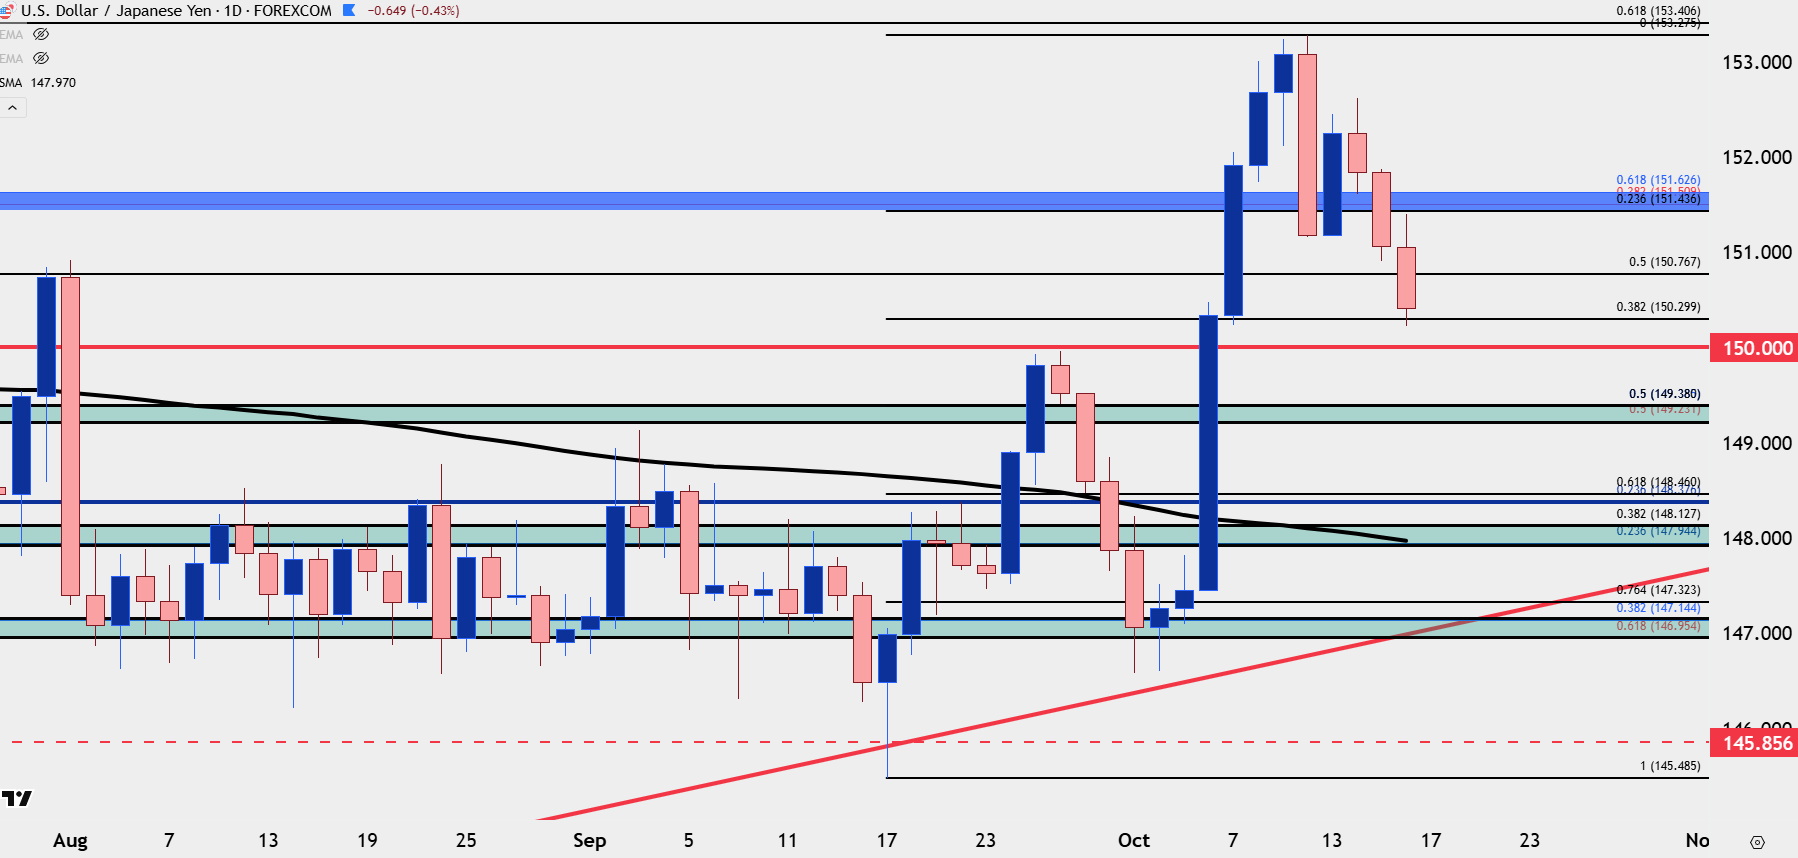
Chart prepared by James Stanley; data derived from Tradingview
EUR/JPY
As USD/JPY has crafted that continued series of lower-lows on the four-hour chart, EUR/JPY has now held the same low for the past two days, and we’re nearing a third day of stal at that price of 175.43. That’s a relevant level as that was the high last year, which saw only one daily close above the 175 psychological level until the 2,000+ pip reversal showed up on the morning of July 11th.
The Fibonacci retracement produced by the July pullback retains some value, as the 161.8% extension has held the high for two of the past three days, and the 127.2% extension is now secondary support, which was also prior resistance. That plots right around the 175 level so there’s also an element of confluence to work with there.
If we do see a surge of Yen-strength, I’d anticipate a test below 150.00 in USD/JPY but a hold at the 175.00 level in EUR/JPY can keep the door open for longs.
EUR/JPY Daily Price Chart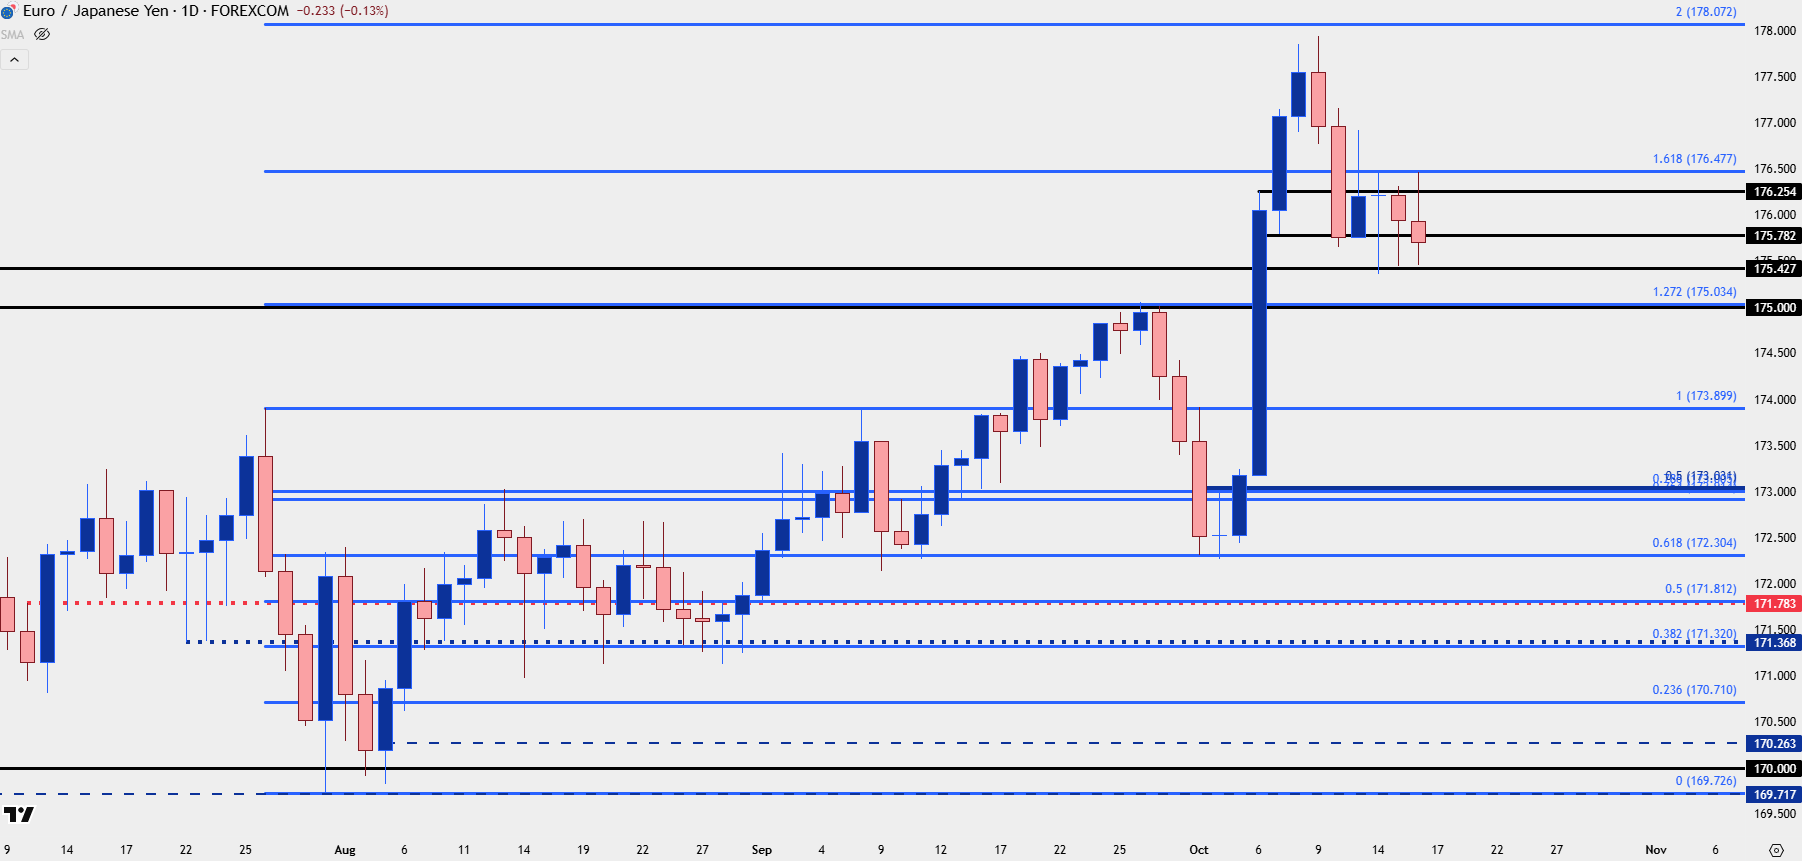
Chart prepared by James Stanley; data derived from Tradingview
GBP/JPY
We’re at a big spot on a longer-term basis for GBP/JPY. So far this week has been a doji with highs holding inside of the prior week’s print. On a shorter-term basis, however, this can be a bit easier to negotiate as there’s been a show of relative strength when compared to the above two setups, but this illustrates the importance of the 76.4% Fibonacci retracement of the pullback move from last year.
GBP/JPY Weekly Price Chart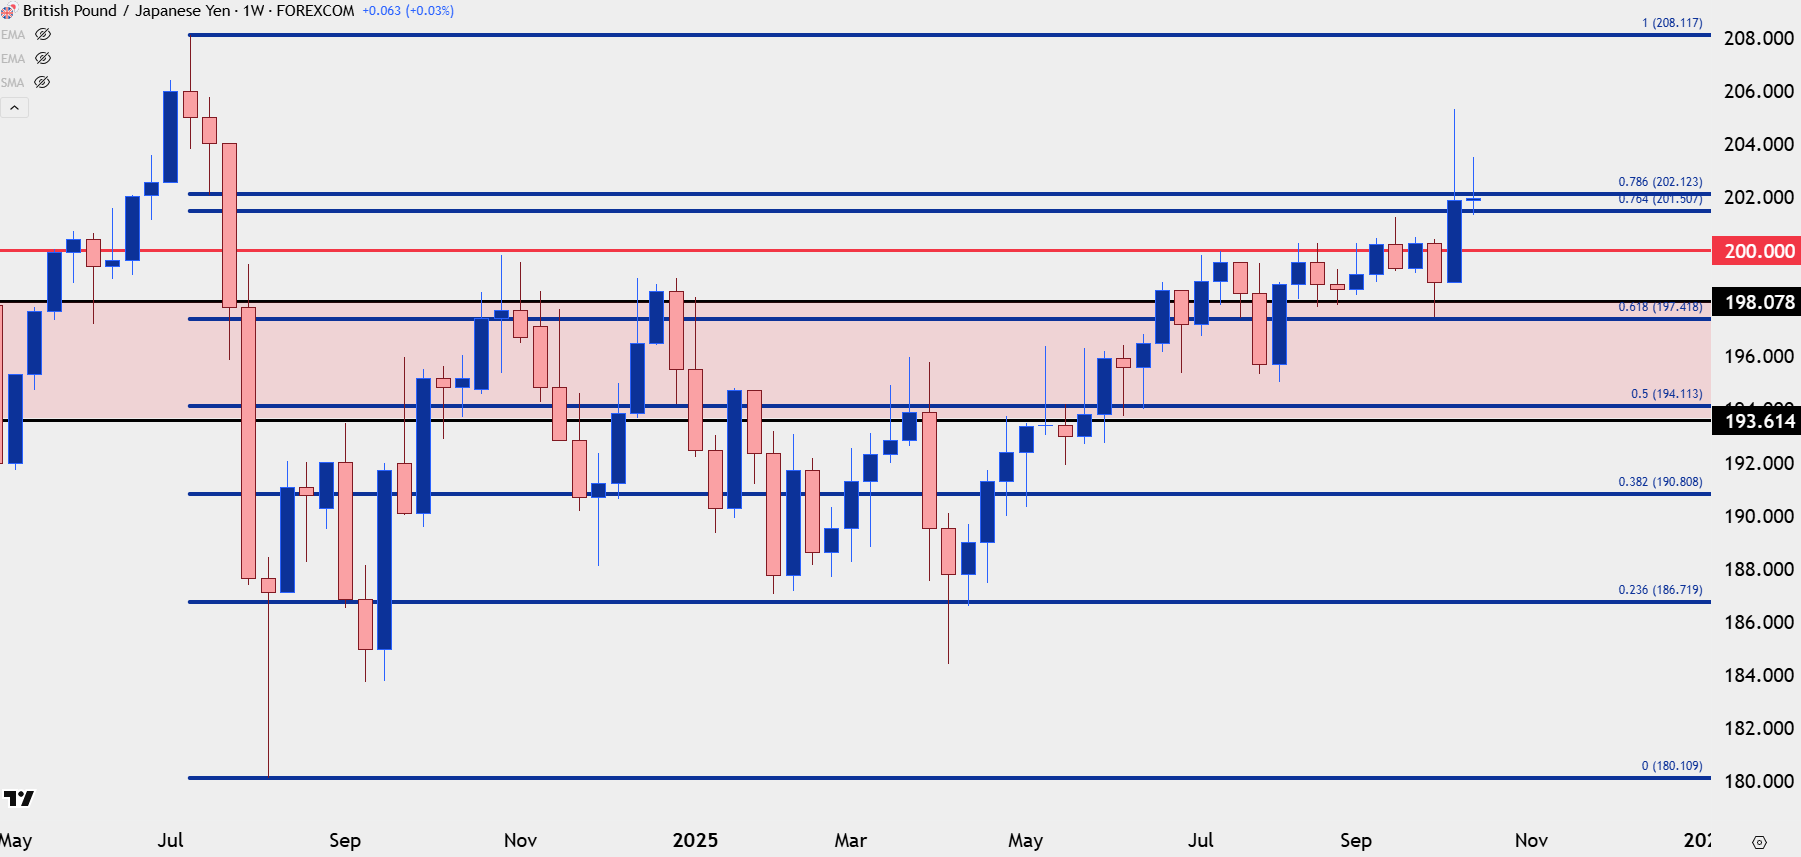
Chart prepared by James Stanley; data derived from Tradingview
GBP/JPY
While EUR/JPY has held flat lows over the past two (almost three) days at last year’s swing high, GBP/JPY held a higher-low yesterday and is working on another today. That sets up the pair as slightly more bullish than EUR/JPY and quite a bit more bullish than USD/JPY above, and that deduction can highlight a few pockets of opportunity.
If looking for Yen-strength, USD/JPY down for a test of 150.00 could be more attractive. If looking for Yen-weakness, GBP/JPY’s higher-lows can make for a stronger argument than EUR/JPY. If we do see Yen-strength show first, that 175.00 level in EUR/JPY can remain an attractive spot to look for short-term reversals; but until that scenario presents it’s the higher-lows in GBP/JPY that can set the pair up as a more attractive backdrop for tracking Yen-weakness.
GBP/JPY Daily Price Chart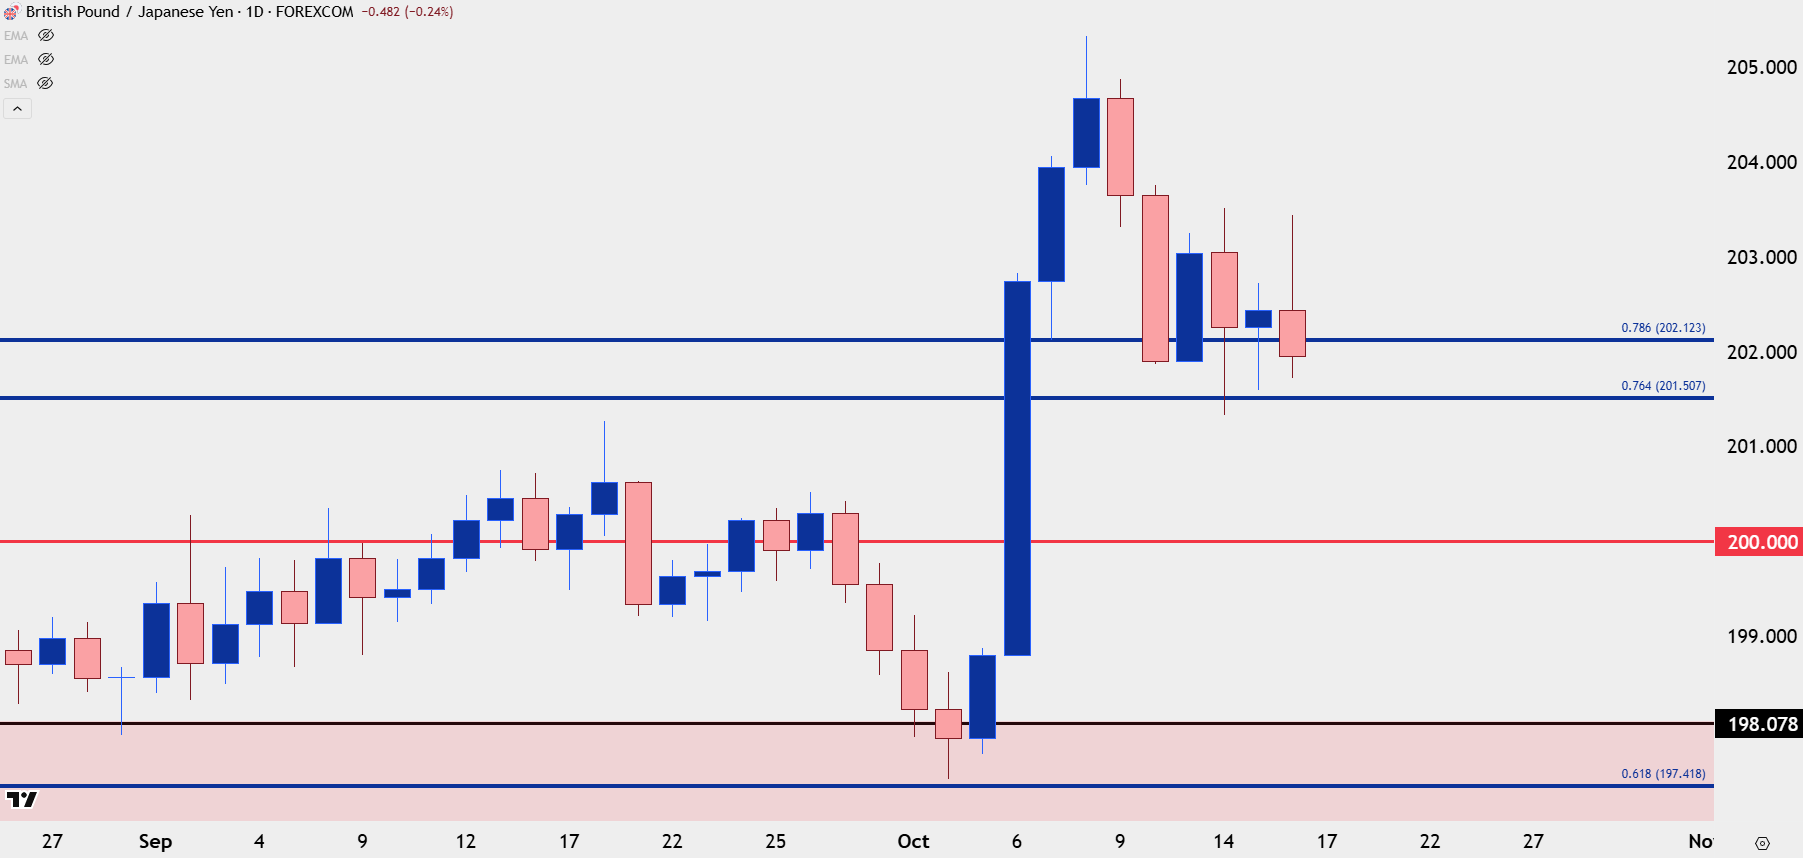
Chart prepared by James Stanley; data derived from Tradingview
--- written by James Stanley, Senior Strategist