
The U.S. equity index has posted a drop of over 1% across the last four trading sessions, amid a backdrop of rising market uncertainty. For now, the bearish bias remains firmly in place, as growing doubts emerge around whether interest rate cuts in the U.S. will happen soon, alongside a gradual deterioration in sentiment indicators. If these factors persist, downward pressure could gain further momentum in the short term.

Are rate cuts approaching?
Much of the recent rally in the SPX has been supported by expectations of a potential rate cut from the Federal Reserve. Lower interest rates across the U.S. would translate into reduced borrowing costs, which in turn could boost domestic consumption and support the operating performance of key companies in the index. This could help consolidate a more optimistic growth outlook, serving as a catalyst for a stronger recovery in equities in the short term.
This expectation is already priced in by the CME Group’s probability model, which currently shows an 84.9% chance that the Fed will cut rates from 4.5% to 4.25% at its September 17 meeting.
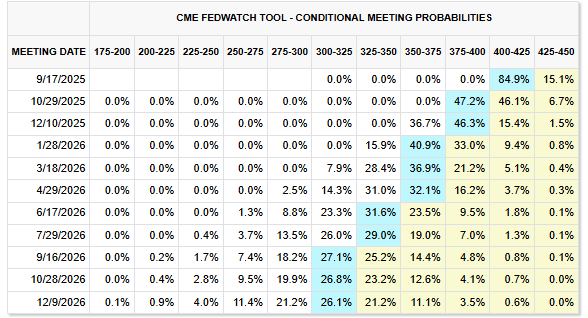
Source: CMEGroup
However, uncertainty has also grown over whether such cuts will materialize or if the Fed will instead stick to a neutral stance. This week, the Jackson Hole Symposium will be held, and Fed Chair Jerome Powell is scheduled to speak on Friday, August 22. His comments may offer clues about the future of the rate cycle, which has increased market caution heading into the event.
This shift is already visible in the performance of the index’s top five stocks, which have recently declined: Nvidia -3.36%, Microsoft -1.51%, Apple -0.3%, Amazon -1.72%, and Meta -2.22%, respectively.
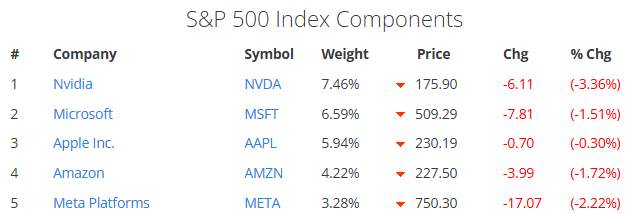
Source: Slickcharts
As Jackson Hole approaches, markets may find a clearer direction. If a short-term rate cut is not confirmed, investor confidence may take another hit, weakening sentiment among major S&P 500 constituents and fueling further bearish momentum.
What About Market Sentiment?
Investor sentiment in the equity markets has also started to weaken, partly due to uncertainty surrounding monetary policy. According to the AAII Investor Sentiment Survey, only 29.9% of investors hold a bullish view of the market, while 24.0% are neutral and 46.2% hold a bearish outlook for the next six months.
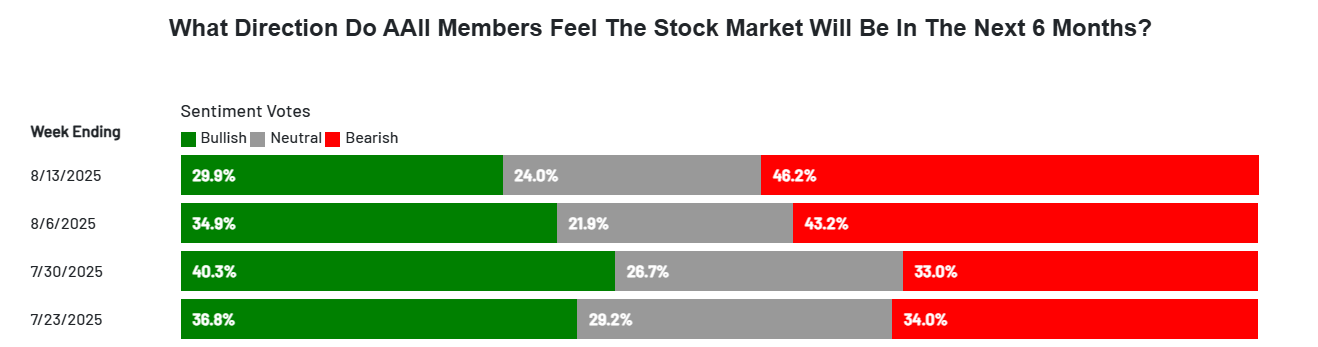
Source: AAII
For now, as sentiment continues to deteriorate gradually, it's likely that demand for exposure to the SPX will keep declining. This could support persistent selling pressure on the index over the near term.
S&P 500 Technical Outlook
Source: StoneX, Tradingview
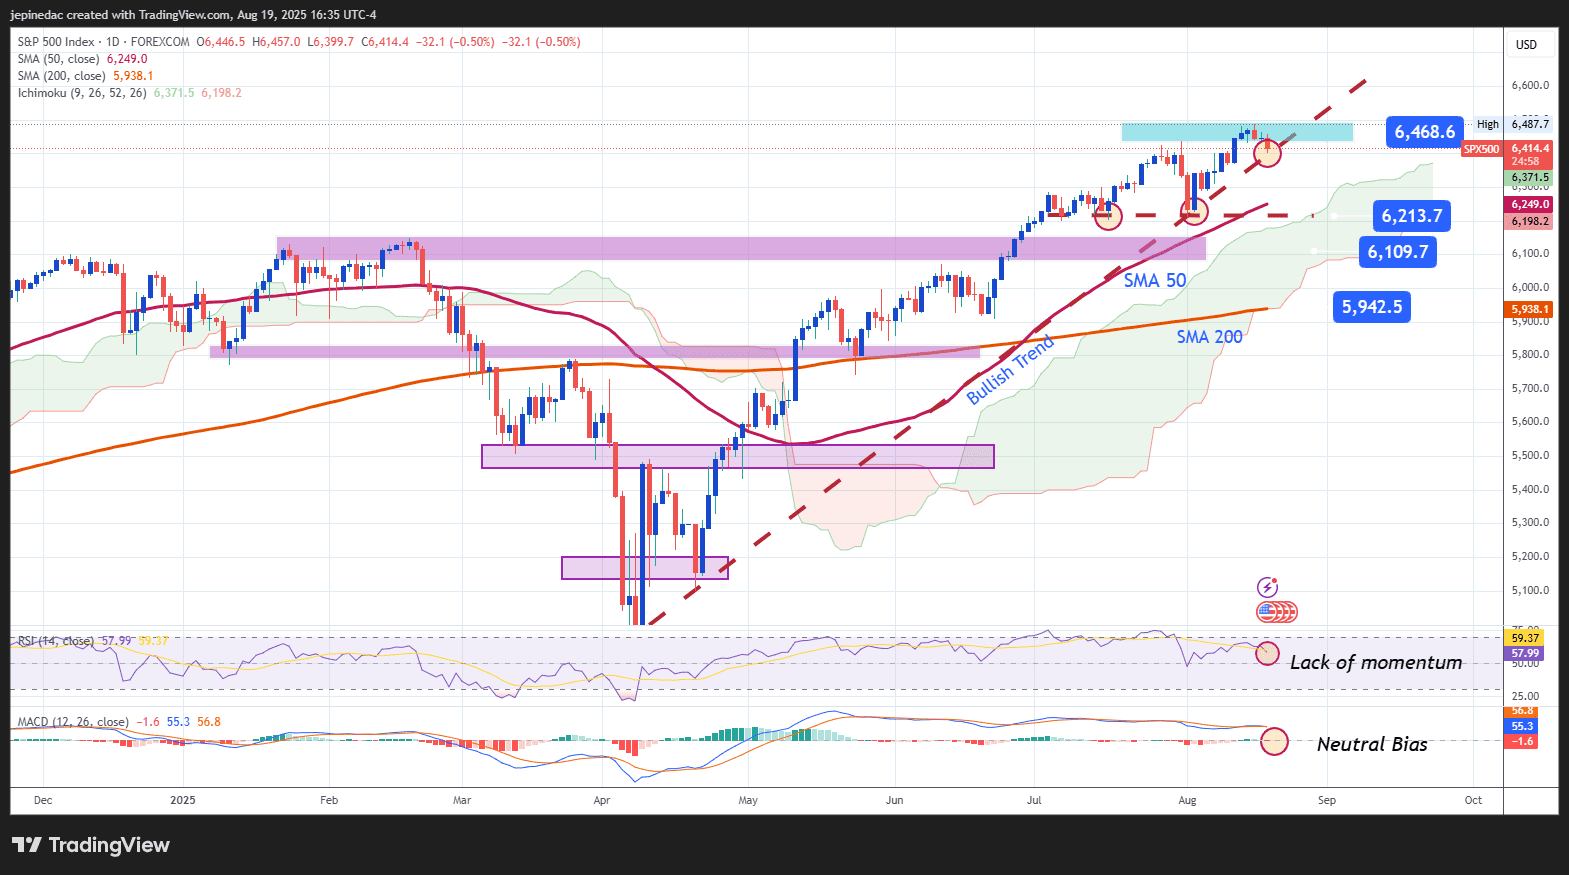
- Uptrend Remains but Signs of Fatigue Appear: Despite recent corrections, the index still retains its broader bullish structure, with no confirmed technical breakdown yet. However, growing neutrality in momentum has started to cap further gains. If this lack of direction persists, the sustainability of the current uptrend may come into question.
- RSI: The Relative Strength Index continues to show a steady downward slope, approaching the neutral 50 line, which indicates a loss of bullish momentum. If the RSI continues to decline, the short-term bias could turn negative.
- MACD: The MACD histogram has hovered near the zero line for several sessions, reflecting a lack of clear direction. This suggests that the market is in a transitional phase, with a new directional bias potentially emerging in the coming days.
Key Levels to Watch:
- 6,468 – Major Resistance: This level marks the all-time high and remains the most important short-term barrier. A confirmed breakout above this zone could reignite bullish momentum and open the door to a new upward phase.
- 6,213 – Near-Term Support: This level is tied to the recent lows and overlaps with the 50-period moving average. A break below it could represent an early bearish signal, threatening the current bullish trend on the chart.
- 6,109 – Critical Support: Located in a neutrality zone observed in February, this support is technically significant. If price falls below this area, it could confirm the start of a more established downtrend.
Written by Julian Pineda, CFA – Market Analyst
Follow him on: @julianpineda25