
The Japanese yen is regaining traction, pushing USD/JPY and AUD/JPY toward key technical support levels. A softer US dollar backdrop and renewed focus on volatility have dragged USD/JPY below the closely watched 155 handle, while AUD/JPY has rolled over from multi-year highs. With both pairs probing pivotal levels, traders are now assessing whether yen strength extends or gives way to a corrective bounce.
View related analysis:
- Australian Dollar Outlook: Momentum Fades as US Data Takes Centre Stage
- Japanese Yen Technical Outlook: USD/JPY, CHF/JPY, AUD/JPY
- Australian Dollar Outlook: Soft Jobs Cools AUD/USD Momentum
- ASX 200 Market Outlook: Bulls Defend Key Support After Monday’s Pullback
Yen Strength Pressures USD/JPY and AUD/JPY at Key Support
November’s Nonfarm Payrolls report was mixed, though it slightly favoured doves as unemployment rose 0.2 percentage points to a four-year high of 4.6%. This marks a fourth consecutive monthly increase — the worst run since January 2009. While the 64k jobs added beat expectations of 50k and marked a sharp rebound from the prior -1.5k print – prompting some positive headlines for job growth - the broader trend is clearly pointing lower.
The US dollar was the weakest major currency on the day, with the Australian dollar a close second. The US dollar index traded down to a 42-day low before recouping around two-thirds of the session’s losses, leaving a potential bullish hammer on the daily chart.
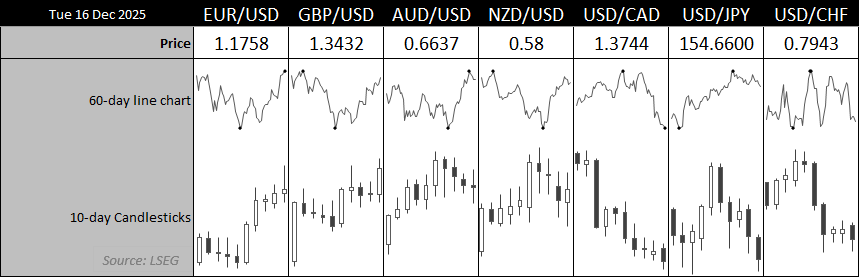
Chart analysis by Matt Simpson - source: LSEG
- EUR/USD formed a prominent shooting star near the 1.18 handle on the daily chart, hinting at bullish exhaustion and flagging the risk of a near-term retracement
- USD/CAD fell to a 65-day low, though support is nearby, with the August and September lows less than half a day’s average daily range away
- GBP/USD reached a 42-day high, with the British pound the strongest FX major on Tuesday
- USD/JPY slipped back below 155, leaving the October high in focus for bears to challenge
- AUD/USD fell for a fourth straight session, though a wide-legged doji formed and price held above the October high, hinting at a near-term swing low

USD/JPY Technical Analysis: US Dollar vs Japanese Yen
USD/JPY has posted its first daily close below 155 in a month. The level has drawn close attention since a former MOF official described it as a “line in the sand” for potential currency intervention a couple of years ago. That does not make 155 a hard trigger when crossed, but the risk of intervention increases if USD/JPY accelerates higher through it — particularly as the BOJ closely monitors volatility.
Regardless, the market clearly has a memory. The 155 handle has repeatedly acted as both support and resistance, making it a key reference point for yen traders. As such, a daily close beneath it is worth noting.
USD/JPY is now holding above last week’s low, though a break beneath it would likely open the door to a deeper retracement. The monthly S1 pivot sits near 153.28, making it a viable downside target for bears — or a level where bulls may reassess dips if downside momentum persists.
Still, a falling wedge is forming on the 4-hour chart, while a bearish divergence has developed on the RSI (2) within oversold territory. This leaves scope for a near-term bounce while prices hold above 154.34.
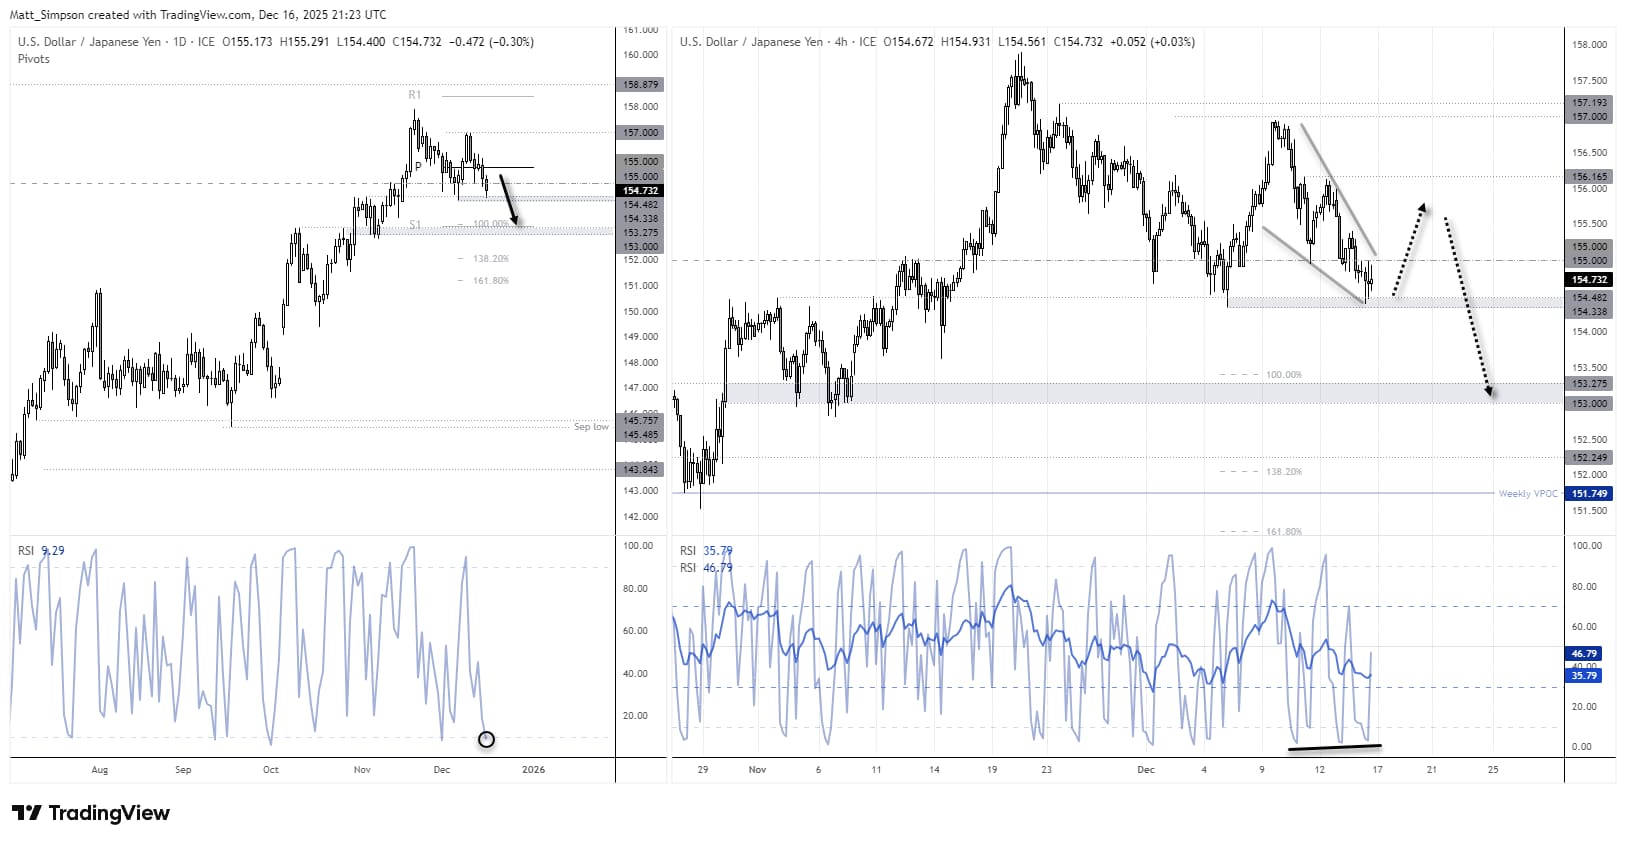
Chart analysis by Matt Simpson - data source: TradingView USD/JPY

AUD/JPY Technical Analysis: Australian Dollar vs Japanese Yen
The Australian dollar remains in a strong uptrend against the Japanese yen, with AUD/JPY reaching a 16-year high last week. However, the 2008 high proved a tough nut to crack, triggering a much-needed pullback. That retracement has produced five consecutive bearish daily candles — the first such sequence since August 2024.
Support is close at hand, with the November 2024 high, December VPOC and 20-day EMA clustered around the 102.50 area, making it a pivotal level for AUD/JPY traders. With the daily RSI (2) now stretched and a bullish pin bar alongside bullish divergence visible on the 4-hour chart, the pair may be able to muster a near-term bounce back towards the 103 handle.
That said, bearish momentum remains evident. Traders should stay alert to the risk of a break lower, which could open the door to a move towards the 102 handle or the 101.51 low.
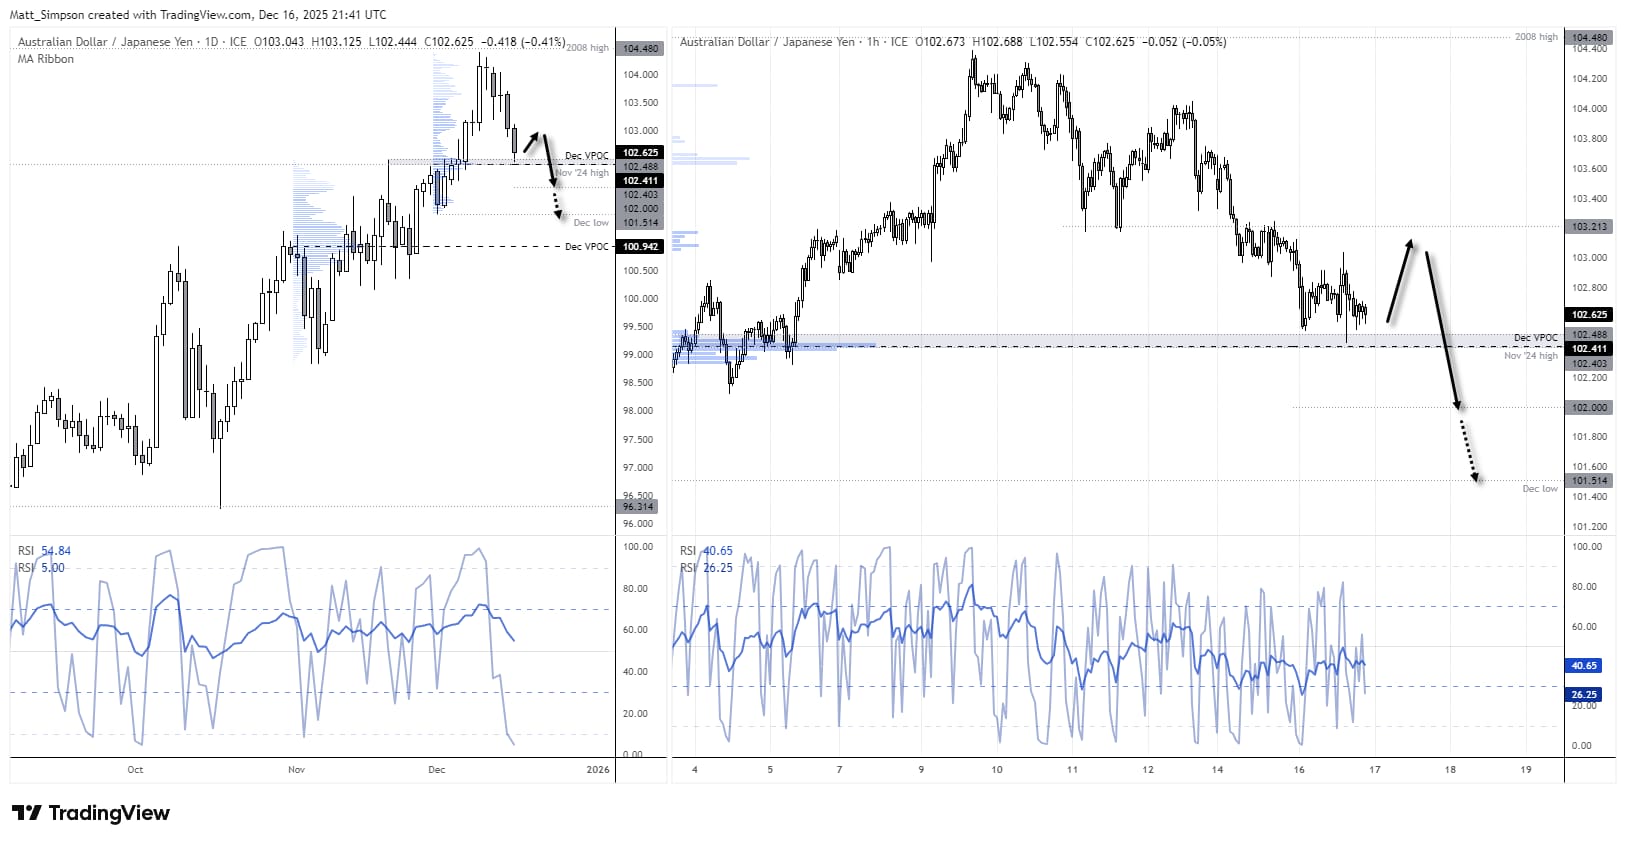
Chart analysis by Matt Simpson - source: TradingView AUD/JPY
View the full economic calendar
-- Written by Matt Simpson
Follow Matt on Twitter @cLeverEdge