Key Events
- USDCAD and USDJPY are testing six-month resistance levels at 1.4080 and 153.30, respectively, as overbought momentum across DXY and major dollar pairs retests January 2025 highs.
- The question now: are we in for a pullback, or will dollar pairs extend their stretch — similar to precious metals — as the US government shutdown continues?
DXY Outlook: Daily Time Frame – Log Scale
Source: Tradingview
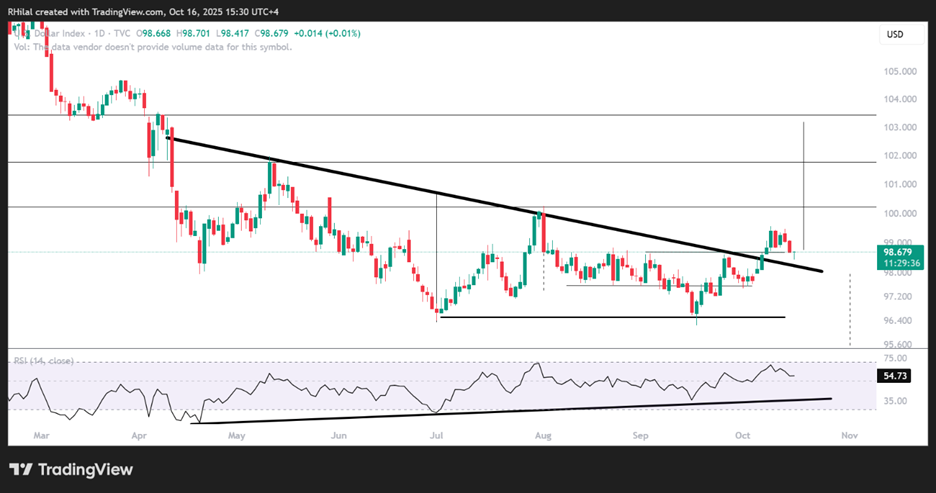
With dovish sentiment returning to headlines, the DXY has paused to recharge its bullish momentum, pulling back toward the trendline connecting consecutive lower highs between May and September 2025. This also aligns with a daily RSI retreat from overbought levels last seen in December 2024.
Key zones to watch on the DXY:
- 99.50–100.20: A critical resistance area that could reignite bullish sentiment toward 101 and 103.
- 98.30: The 0.382 Fibonacci retracement and the May–September trendline’s previous resistance, now acting as support. A hold above this level could fuel another rebound, while a break below may send the DXY back toward 97.50, consolidating into a zone of bearish uncertainty.
The impact on USDCAD and USDJPY is similar: haven demand appears overstretched across precious metals, and dollar pairs are experiencing short-term pullbacks driven by daily overbought momentum and dovish sentiment — while weekly and monthly charts still have more upside potential.
USDCAD Outlook: Weekly Time Frame – Log Scale
Source: Tradingview
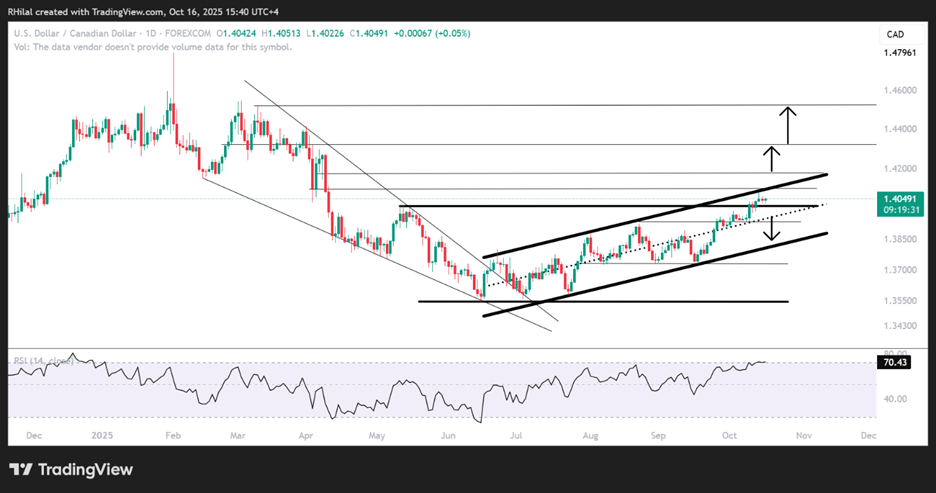
On the daily chart, USDCAD shows clear signs of overbought momentum as price action holds between 1.4080 resistance and 1.4020 support, capped below the upper boundary of a well-respected uptrend channel from June to October 2025.
A decisive break above 1.4080 and the channel’s upper boundary would open the door for further gains toward 1.4180, 1.4320, and 1.4520, derived from Fibonacci retracement levels of the downtrend between February 2025 (1.4790) and June 2025 (1.3540).
From the downside, if prices remain capped within the channel, a drop below 1.4000 could extend losses toward 1.3930 and 1.3800, possibly finding support near the lower channel boundary once again.
USDJPY Outlook: Daily Time Frame – Log Scale
Source: Tradingview
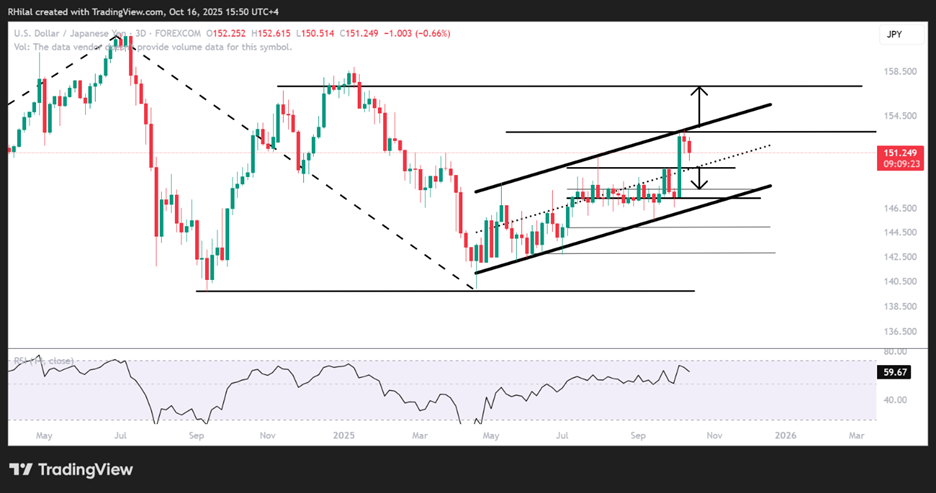
To minimize short-term noise, the three-day chart is used for the USDJPY outlook, showing overbought momentum levels last seen in January 2025. The price structure closely mirrors USDCAD’s, with the pair testing the upper boundary of a rising channel extending from April to October 2025.
A confirmed breakout above the channel border and 153.30 resistance would confirm the next leg higher toward the 157.00 zone.
On the downside, if prices remain capped within the channel and fall below the midrange and 149.90 support, losses could extend toward the lower boundary, potentially finding support between 148.00 and 147.40.
Written by Razan Hilal, CMT
Follow on X: @Rh_waves