



Asian indices hold key support, but for how long?
Several key markets have reached key support levels across Asia, so traders need to decide whether to buy at these lows or try and break them down further.
Share this:

The Hang Seng Index (HSI) has extended its decline to invalidate our previous bias (that the market was performing a multi-month reversal). Part of that original argument was based on bullish volume preceding prices, yet in the past two weeks we have now seen bearish volumes dominate as prices have fallen.
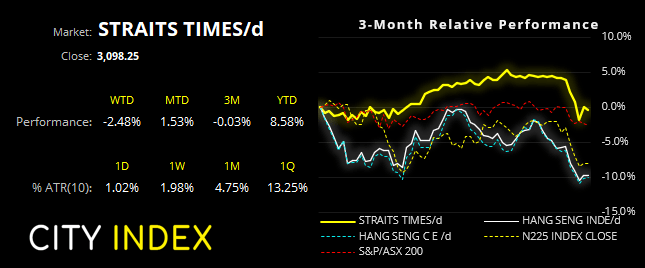

Of course, what has not helped is decline of Alibaba (BABA). The stock has continued to print new all-time lows on high volume following their profit warning last month. Whilst Tencent (the largest stock on the index) isn’t in freefall it is clearly lacking bullish interest overall and sits just above a 3-month low. And although investors dumped Alibaba for JD.com, it is hardly in a strong bullish trend of its own. Ultimately, the trop three stocks of the HIS are not ‘doing their bit’ to support the broader index, which has allowed the HSI to fall to its lowest level since September 2020.


The HSI trades in a bearish channel on the daily chart and momentum leading into these lows has become increasingly bearish. Therefore the bias is now for an eventual break below 23,000. Yet the potential for a bounce from key support is also apparent, as the RSI (2) and RSI (14) both reached oversold levels and there has been little in the way of a pullback on the daily chart.


Furthermore, the Hang Seng China Enterprise Index (HSCE) has also stalled at a key support level at the same time as the Hang Seng. When you see multiple markets stall at such levels it can be an indication that traders may be about to book profits or simply switch direction over the near-term.
Plans are still on for Hong Kong to partially reopen with cross-border travel despite Omicron being detected. And if Beijing decides to step in and support the market, perhaps it can provide a more convincing bounce. But with the rapid rise of Covid in other parts of the world, it is hard to imagine we have seen ‘the’ low on these indices just yet. Especially when US markets are only beginning to accelerate their downwards trajectory. We therefore see any potential bounce as an opportunity for bears to enter at a more favourable price in anticipation of Asian indices eventually breaking down further.
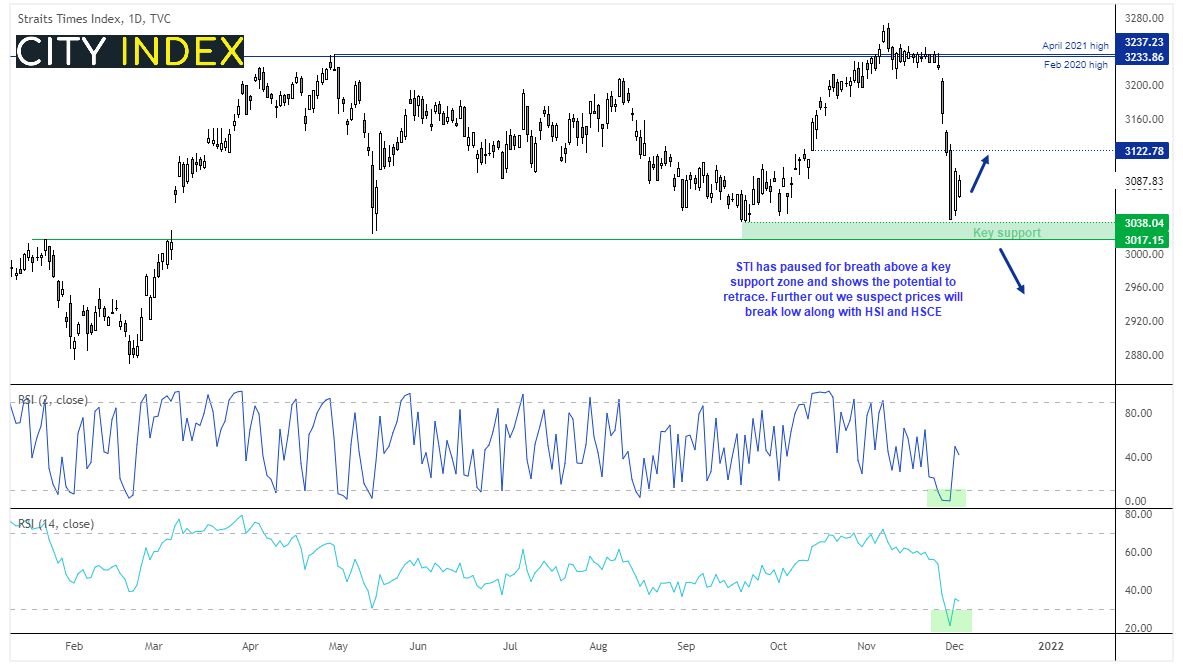

As for the STI, it has fallen over -6% since its false break above a yet resistance zone. The decline was in a fairly straight line and yesterday produced a bullish inside day above the September lows to show bearish momentum is waning. This, along with RSI 2 and 14 being oversold at the lows, echoes the clues left by HSI and HSCE. We therefor also suspect that the STI may be able to at least pause for breath, if not bounce form current levels before losses resume. And a likely driver of how high it bounces or how quickly it breaks key support is likely to be surrounding the developments of the Omicron variant.
How to trade with City Index
You can easily trade with City Index by using these four easy steps:
- Open an account, or log in if you’re already a customer
• Open an account in the UK
• Open an account in Australia
• Open an account in Singapore
- Search for the company you want to trade in our award-winning platform
- Choose your position and size, and your stop and limit levels
- Place the trade
How to trade with FOREX.com
Follow these easy steps to start trading with FOREX.com today:
- Open a Forex.com account, or log in if you’re already a customer.
- Search for the pair you want to trade in our award-winning platform.
- Choose your position and size, and your stop and limit levels.
- Place the trade.
Related tags:
Latest market news




The complete CFD trading experience
Award-winning platforms, competitive spreads, low commissions and dedicated support.
We live and breathe the markets and are dedicated to helping traders realise their ambitions as we continue to set the industry bar.
Economic calendar
Web Trader platform
Our sophisticated web-based platform is packed with features.
Related articles
EUR/USD Q4 2026 Outlook: Euro at a Crossroads as Fed, ECB Tighten 9 25 2026
EUR/USD enters Q4 at a pivotal inflection point as competing Fed-ECB policy paths and persistent inflation risks collide with major technical support.


USD/JPY Q4 2026 Outlook: Hawkish Fed Pricing Clashes With Intervention Risk
The year-end tug-of-war is clear: hawkish Fed pricing supports USD/JPY, while intervention risk limits the upside.


Japanese Yen Forecast: USD/JPY 4% Rally Challenges Post-Intervention Downtrend 9 24 2026
USD/JPY momentum has shifted sharply higher, putting a major resistance confluence in focus as U.S. and Japanese event risk builds.
StoneX Europe Ltd may make third party material available on this website which may contain information included but not limited to the conditions of financial markets. The material is for information purposes only and does not contain, and should not be construed as containing, investment advice and/or investment recommendation and/or an investment research and/or an offer of or solicitation for any transactions in financial instruments; any decision to enter into a specific transaction shall be made by the client following an assessment by him/her of their situation.
StoneX Europe Ltd makes no representation or warranty and assumes no liability as to the accuracy or completeness of the information provided, nor any loss arising from any investment based on a recommendation, forecast or other information supplied. You should always seek independent advice as to your suitability to speculate in any related markets and your ability to assume the associated risks, if you are at all unsure. We are not under any obligation to update any such material. Any opinion made may be personal to the author and may not reflect the opinion of StoneX Europe Ltd.