



AUD/USD, ASX 200 Analysis: The US dollar falls after Powell’s testimony
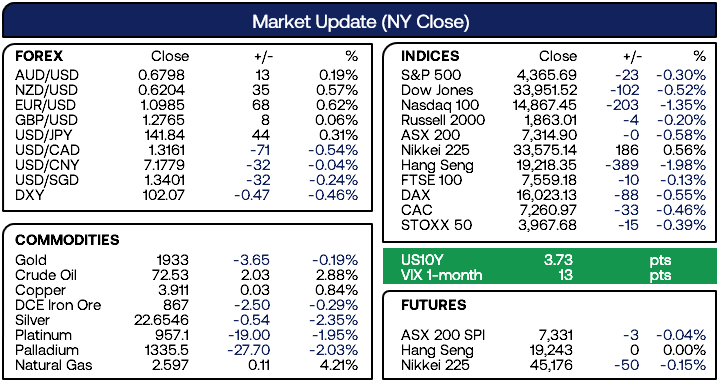
The US dollar was the weakest major overnight, helping EUR/USD reach a 6-week high, USD/CAD a 9-month low and AUD/USD form a bullish hammer on the daily chart.
Share this:

Market summary
- Jerome Powell told congress that rates will need to move higher to tame inflation via lower growth, adding that the speed (of hikes) was more important at the start but not important now
- Wall Street pulled back for a third day although the lack of bearish follow through suggests some were expecting something more hawkish from Powell
- An intraday double bottom formed on the S&P 500 ~4360 and the Nasdaq 100 held above 14,800
- The US dollar was the weakest FX major
- EUR/USD closed to a 6-week high and is less than 20 pips from testing 1.1000
- USD/CAD closed to a 9-month low
- USD/CHF formed a likely swing high around 0.9000 ahead of today’s SNB meeting
- AUD/USD formed a bullish hammer day
- Stubbornly high UK inflation keeps the pressure on an already-hawkish BOE, with core CPI a 31-year high of 7.1% y/y (0.8% m/m)
- The 1-year OIS (overnight index swap) now fully pricing in a 5.75% interest rate, which leaves room for five 25bp hikes from the current 4.5%
- GBP/USD spiked up to our initial 1.028 resistance zone, before reversing and retesting Tuesday’s low as traders mulled the increasing likelihood of a hard landing for the UK economy
- Strong retail sales data for Canada has increased bets the BOC could hike again in July and sent USD/CAD to a 9-month low
- Australia’s Treasurer announced that they intend to finalise the appointment of the next RBA governor by July
Events in focus (AEDT):
- 09:50 – JP foreign investment, BOJ member Noguchi speaks
- 18:00 - SNB meeting
- 21:00 - BOE meeting

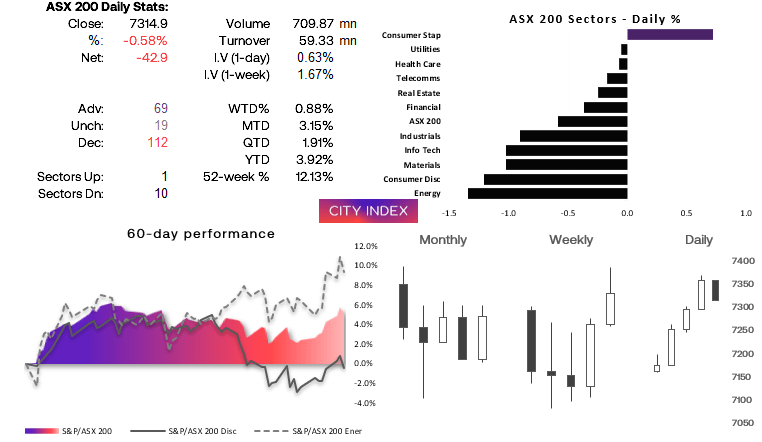
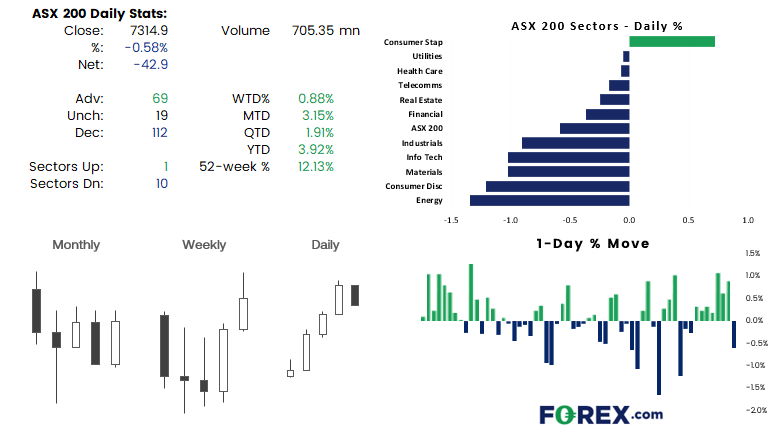
ASX 200 at a glance:
- A bearish inside day formed on the ASX 200 daily chart
- This snapped a 7-day winning streak
- Weak lead from Wall Street points to a soft open
- 7300 is likely pivotal area for bulls/bears today
AUDUSD daily chart:
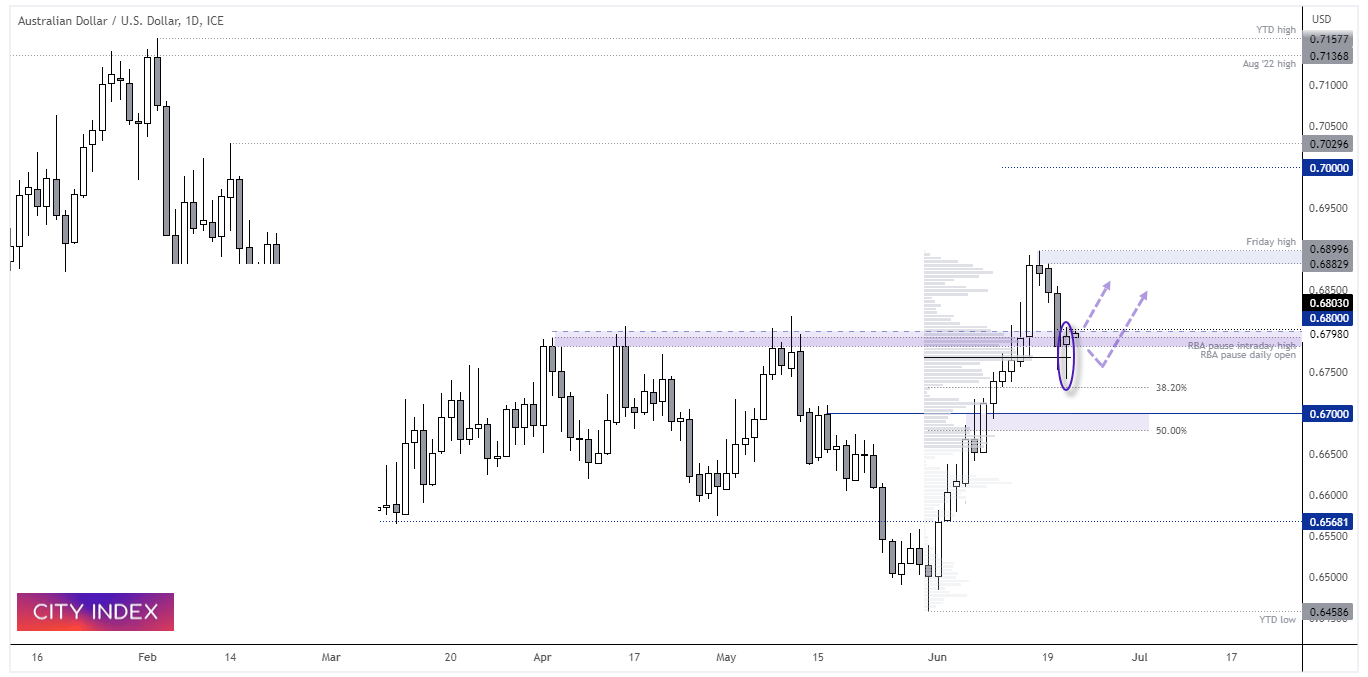
After three bearish days and a bullish pinbar (which closed within a key resistance zone), I suspect it may be time for AUD/USD to post a minor rebound at a minimum. The hammer’s lower wick also formed around a volume cluster from the prior rally, so any intraday pullback towards 0.6770 could be of interest if it forms a swing low. We’re now looking for a breakout and potential move to 0.6850, with a move back to last week’s highs being a nice bonus for bulls.
However, if we see bearish momentum form below 0.6800, then we could see AUD/USD head back towards the 0.6700 handle.

-- Written by Matt Simpson
Follow Matt on Twitter @cLeverEdge
How to trade with City Index
You can trade with City Index by following these four easy steps:
- Open an account, or log in if you’re already a customer
• Open an account in the UK
• Open an account in Australia
• Open an account in Singapore
- Search for the market you want to trade in our award-winning platform
- Choose your position and size, and your stop and limit levels
- Place the trade
Latest market news




The complete CFD trading experience
Award-winning platforms, competitive spreads, low commissions and dedicated support.
We live and breathe the markets and are dedicated to helping traders realise their ambitions as we continue to set the industry bar.
Economic calendar
Web Trader platform
Our sophisticated web-based platform is packed with features.
Related articles
EUR/USD weekly outlook: Oil, inflation and NFP in focus
After coming under significant pressure in recent weeks, the EUR/USD came off its lows to finish the week on a positive note on Friday, albeit with only a mild rebound. That was not enough to prevent the exchange rate falling for the third consecutive week, as the US dollar and bond yields rallied across the board.

Gold Q4 2026 outlook: Resilience in the face of rallying dollar and yields
As we headed towards the latter stages of Q3 and into Q4, the Fed had just hiked rates in a hawkish FOMC meeting, while the likes of the ECB and BoJ had also tightened their respective policies. Oil prices remained elevated amid the prolonged US-Iran conflict. Meanwhile, bond yields were breaking out, and the dollar was higher across the board. Yet, remarkably, gold was still holding in the positive territory for the third quarter, even if it had weakened somewhat in September.

EUR/USD Q4 2026 Outlook: Euro at a Crossroads as Fed, ECB Tighten 9 25 2026
EUR/USD enters Q4 at a pivotal inflection point as competing Fed-ECB policy paths and persistent inflation risks collide with major technical support.
StoneX Europe Ltd may make third party material available on this website which may contain information included but not limited to the conditions of financial markets. The material is for information purposes only and does not contain, and should not be construed as containing, investment advice and/or investment recommendation and/or an investment research and/or an offer of or solicitation for any transactions in financial instruments; any decision to enter into a specific transaction shall be made by the client following an assessment by him/her of their situation.
StoneX Europe Ltd makes no representation or warranty and assumes no liability as to the accuracy or completeness of the information provided, nor any loss arising from any investment based on a recommendation, forecast or other information supplied. You should always seek independent advice as to your suitability to speculate in any related markets and your ability to assume the associated risks, if you are at all unsure. We are not under any obligation to update any such material. Any opinion made may be personal to the author and may not reflect the opinion of StoneX Europe Ltd.