



Asian Open: Gold breaks out, oil pulls back as supply concerns ease
For what seems like the firt day in a while, gold and oil prices diverged to the benefit of the yellow metal.
Share this:

Thursday US cash market close:
- The Dow Jones Industrial rose 349.44 points (1.02%) to close at 34,707.94
- The S&P 500 index rose 63.92 points (2.51%) to close at 34,058.75
- The Nasdaq 100 index rose 318.15 points (2.2%) to close at 14,765.70
Asian futures:
- Australia's ASX 200 futures are up 0 points (0.03%), the cash market is currently estimated to open at 7,387.10
- Japan's Nikkei 225 futures are up 260 points (0.93%), the cash market is currently estimated to open at 28,370.39
- Hong Kong's Hang Seng futures are down -96 points (-0.44%), the cash market is currently estimated to open at 21,849.95
- China's A50 Index futures are down -3 points (-0.02%), the cash market is currently estimated to open at 13,785.97
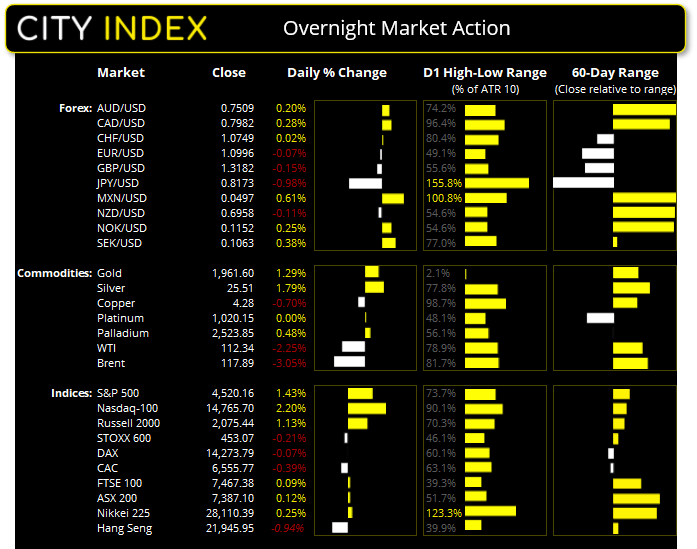
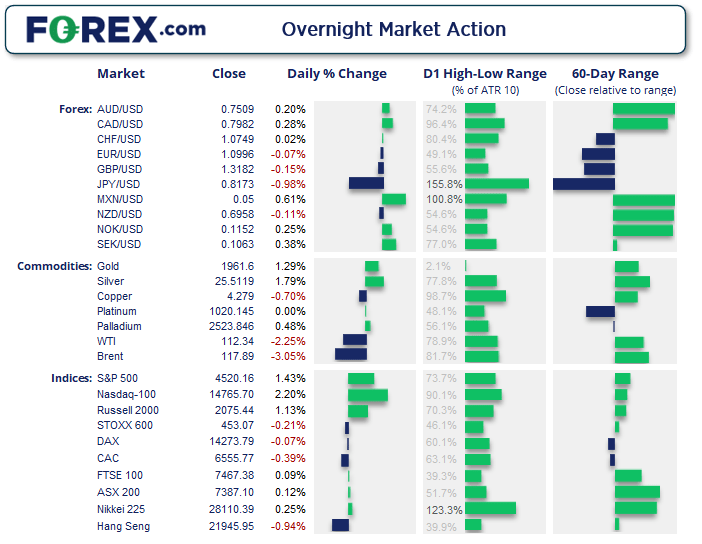
Our anticipated pullback on US indices is yet to materialise, with major benchmarks all posting gains by the close. Tech stocks led the rebound with the Nasdaq rising 2.2%. The S&P 500 closed above 4520 and 88% of its stocks advanced, with all of its 11 sectors posting gains.
ASX 200:
7400 remains the key level for the index heading into the weekend as volatility has receded as prices drifted towards it. A positive lead from Wall Street and higher futures market means we should see a break above it, but the proof in the pudding will be to see if it can close the week above it.


ASX 200: 7387.1 (0.12%), 24 March 2022
- Utilities (2.56%) was the strongest sector and Info Tech (-0.76%) was the weakest
- 4 out of the 11 sectors closed higher
- 7 out of the 11 sectors closed lower
- 4 out of the 11 sectors outperformed the index
- 63 (31.50%) stocks advanced, 125 (62.50%) stocks declined
Outperformers:
- +7.28% - AVZ Minerals Ltd (AVZ.AX)
- +6.51% - Whitehaven Coal Ltd (WHC.AX)
- +4.96% - Brickworks Ltd (BKW.AX)
Underperformers:
- -7.42% - Telix Pharmaceuticals Ltd (TLX.AX)
- -5.17% - Zip Co Ltd (Z1P.AX)
- -4.26% - Healius Ltd (HLS.AX)
Oil prices pulled back
WTI is back below $115 after pulling back perfectly form a 61.5% Fibonacci ratio. It had rallied on the hype that EU officials were to discuss how to remove Russian oil imports and, without such action hitting headlines, allowed energy prices to retrace. But the US is also in discussion for another coordinated release of its oil supplies to alleviate supply concerns. Gasoline was down around -3%, although natural gas rose 3.4%.
Ultra-dovish BOJ continues to weigh on the yen
The Japanese yen continue to tumble after BOJ continued to hammer home that their ultra-loose monetary policy is here to stay, and for quite some time. USD/JPY closed above 1.22 for the first time since December 2015 and is currently enjoying its most bullish month since November 2016. Yen weakness was broadly spready with CAD/JPY outperforming its peers to rise 1.3%. With such strong (and dovish) views from BOJ members it is difficult to see how today’s inflation data will account for much. The weaker yen has been highly beneficial for the Nikkei which has now risen 14% in two weeks and has closed back above its 200-day eMA.
Gold breaks above key resistance
Gold retained its safe-haven status around the NATO summit, where Biden wants to increase troops along the Eastern front and send an official waring against the use of Chemical weapons by Russia. Clearly this will irk Putin and only increase tensions between Russia and the West.
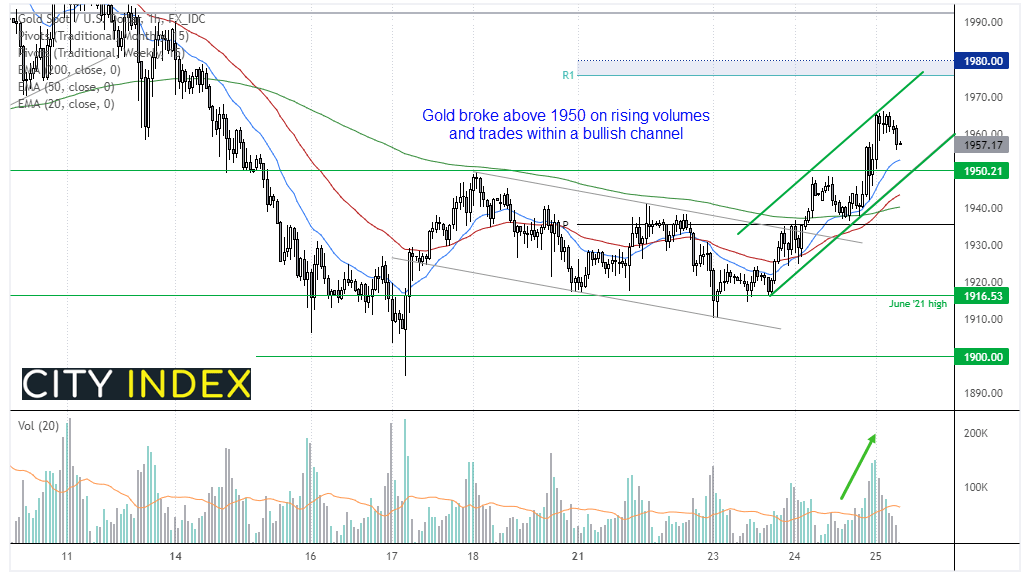
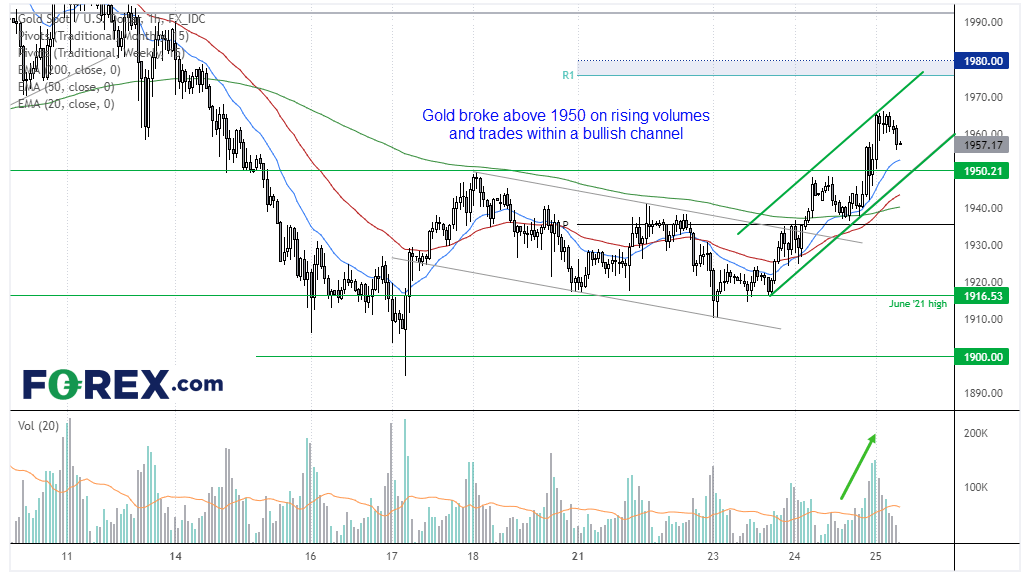
Gold saw a decent break above 1950 resistance yesterday on rising volume. It now trades within a bullish channel on the hourly chart, although now within a retracement phase. From here we would like to see support found somewhere around 1950 (previous resistance), the lower trendline or the 20-hour eMA before seeking fresh bullish opportunities. 1980 remains the target but keep in mind that, if it is not achieved today the weekly pivot point will be recalculated for next week so levels may need to be adjusted.
Up Next (Times in AEDT)
How to trade with City Index
You can easily trade with City Index by using these four easy steps:
- Open an account, or log in if you’re already a customer
• Open an account in the UK
• Open an account in Australia
• Open an account in Singapore
- Search for the company you want to trade in our award-winning platform
- Choose your position and size, and your stop and limit levels
- Place the trade
How to trade with FOREX.com
Follow these easy steps to start trading with FOREX.com today:
- Open a Forex.com account, or log in if you’re already a customer.
- Search for the pair you want to trade in our award-winning platform.
- Choose your position and size, and your stop and limit levels.
- Place the trade.
Latest market news




The complete CFD trading experience
Award-winning platforms, competitive spreads, low commissions and dedicated support.
We live and breathe the markets and are dedicated to helping traders realise their ambitions as we continue to set the industry bar.
Economic calendar
Web Trader platform
Our sophisticated web-based platform is packed with features.
Related articles
Gold Q4 2026 outlook: Resilience in the face of rallying dollar and yields
As we headed towards the latter stages of Q3 and into Q4, the Fed had just hiked rates in a hawkish FOMC meeting, while the likes of the ECB and BoJ had also tightened their respective policies. Oil prices remained elevated amid the prolonged US-Iran conflict. Meanwhile, bond yields were breaking out, and the dollar was higher across the board. Yet, remarkably, gold was still holding in the positive territory for the third quarter, even if it had weakened somewhat in September.
EUR/USD Q4 2026 Outlook: Euro at a Crossroads as Fed, ECB Tighten 9 25 2026
EUR/USD enters Q4 at a pivotal inflection point as competing Fed-ECB policy paths and persistent inflation risks collide with major technical support.

USD/JPY Q4 2026 Outlook: Hawkish Fed Pricing Clashes With Intervention Risk
The year-end tug-of-war is clear: hawkish Fed pricing supports USD/JPY, while intervention risk limits the upside.

StoneX Europe Ltd may make third party material available on this website which may contain information included but not limited to the conditions of financial markets. The material is for information purposes only and does not contain, and should not be construed as containing, investment advice and/or investment recommendation and/or an investment research and/or an offer of or solicitation for any transactions in financial instruments; any decision to enter into a specific transaction shall be made by the client following an assessment by him/her of their situation.
StoneX Europe Ltd makes no representation or warranty and assumes no liability as to the accuracy or completeness of the information provided, nor any loss arising from any investment based on a recommendation, forecast or other information supplied. You should always seek independent advice as to your suitability to speculate in any related markets and your ability to assume the associated risks, if you are at all unsure. We are not under any obligation to update any such material. Any opinion made may be personal to the author and may not reflect the opinion of StoneX Europe Ltd.