





Asian Open USD Enters a Corrective Phase NZDUSD Set to Bounce
A strong NFP print of Friday sent US equities soaring to new highs, commodities rall and the USD falter at its 3-month high, which paves the way for counter-trend moves.
Share this:

Japanese Yen Talking Points:
- USD/JPY traded below the 150.00 level for the first time since early-December.
- Indications continue to stack that the USD may have topped, and with both the USD and USD/JPY setting fresh lows today, the risk is a larger swell of Yen-strength leading into another carry unwind scenario, such as we saw last summer.
- While USD/JPY’s initial reaction to CPI last week was strength, the pair has sold off for five of the six past days, highlighting the shifting dynamic between rate expectations between the U.S. and Japan.
Ever since USD/JPY recovered back above the 150.00 level last October, there hasn’t been much time in the pair below that price. There was the test in early-December, but that was short-lived as bulls quickly came back, helped along by the FOMC meeting in the middle of that month that saw the pair make another run at the 160.00 handle.
But notably, ever since the US Dollar set its current high on January 13th, USD/JPY has taken on a new trend with a consistent series of lower-lows and highs. Today marks another waypoint along the way, as the pair has put in its first test below the 150.00 level in more than two months.
To be sure, these are difficult moves to chase, but given longer-term proximity to highs, there could be an opening for a continued sell-off, especially if the US Dollar reverts into its prior range.
USD/JPY Daily Chart
 Chart prepared by James Stanley; data derived from Tradingview
USD/JPY Bigger Picture
The big question now is whether we’re at the forefront of another episode of carry unwind. Given the longer-term position of the pair, which remains well-elevated from the sub-103 levels that the trend had started at in early-2021, there’s likely a large remaining long position priced-in here.
Perhaps more important for equity markets, there’s probably a lot of leverage in markets outside of Japan that have been funded by the cheap rates furnished by Japanese banks. This is what led to the de-leveraging event last summer, when global equities began to fall as the USD/JPY carry trade unwound.
For institutions that had borrowed Yen at low rates in Japan and then invested it elsewhere, with a hedged position in USD/JPY, the falling spot rate served as a threat. And like we saw last summer, those positions can come off quickly as a crowded trade begins to unwind.
As is often the case across markets, the big driver is one of expectations, and if we are seeing a backdrop where the USD has topped, and where the Bank of Japan may be hiking rates, the motivation for holding long USD/JPY could continue to go down, and this is a likely culprit behind why USD/JPY is down about 6% from the January high while DXY is down by 3.45%, as of this writing.
Since the start of the carry trade back in 2021, there have been multiple episodes of bearish moves. In both November of 2022 and 2023, we saw stern sell-offs start and that’s even with the rate differential soundly favoring the long side of the pair.
Last summer’s sell-off is when that rate differential started to shift in the other direction, and similarly, this shocked longs as prices dropped by more than 2,000 pips in less than a month.
From the weekly chart below, it appears that another bearish leg has begun as the losses have been consistent with price dipping back-below the 150.00 handle.
USD/JPY Weekly Chart
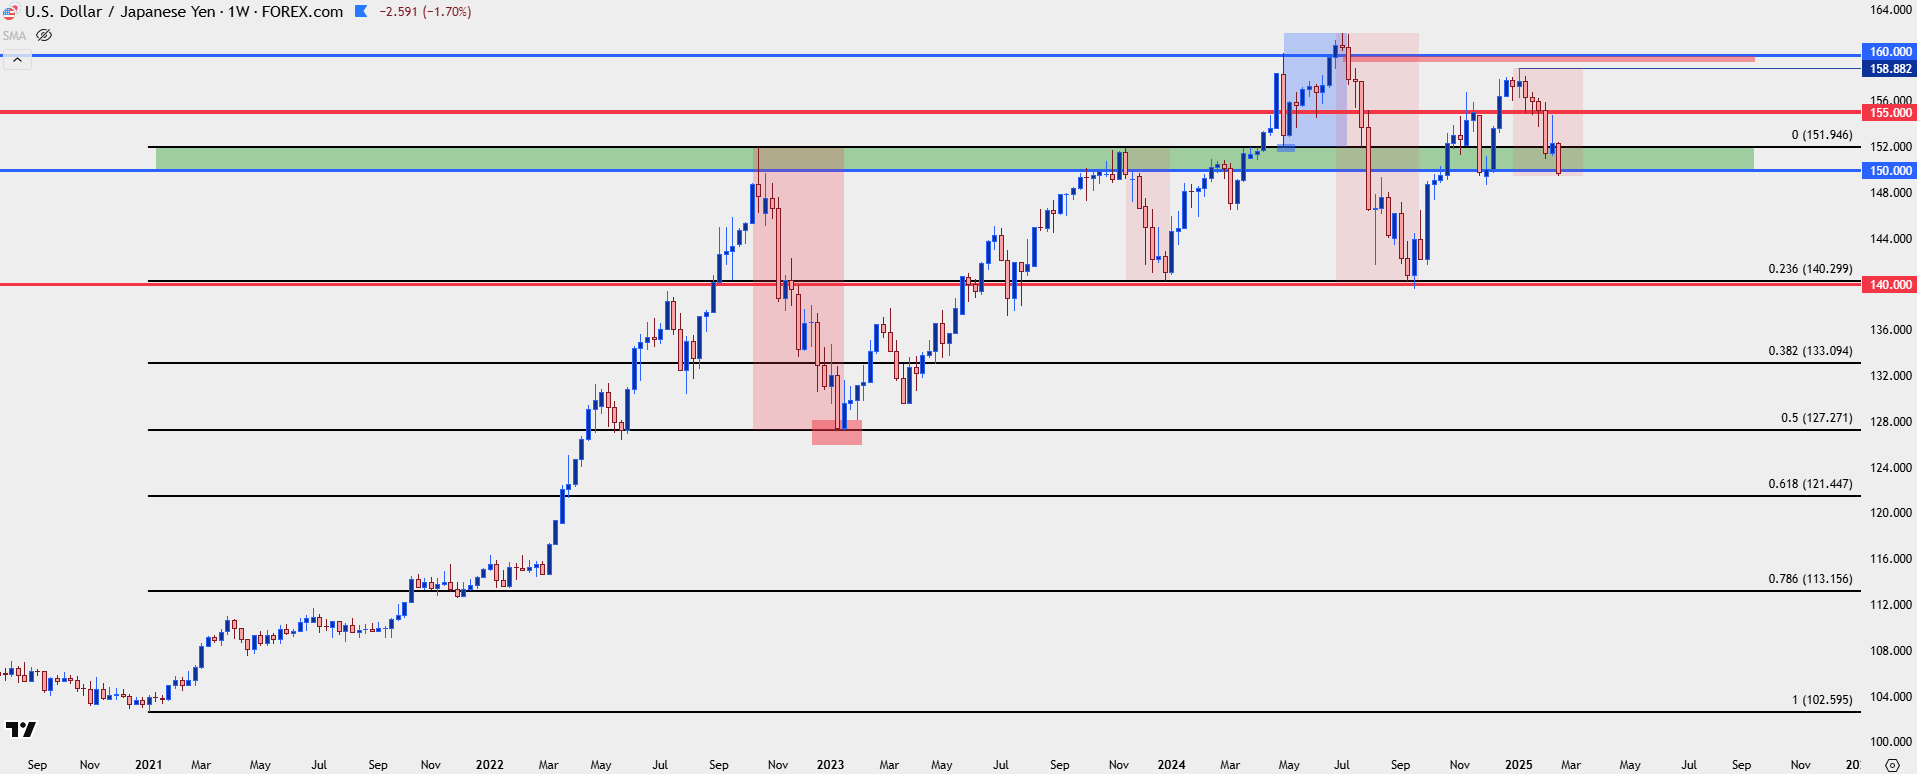 Chart prepared by James Stanley; data derived from Tradingview
USD/JPY Near-Term
The breach of 150.00 could be indication that bears are getting more aggressive, but from a strategy standpoint, trader should still treat this cautiously, as there’ve been numerous twists and turns in the saga around USD/JPY over the past four years.
With price now below the 150.00 handle, that becomes a spot of possible lower-high resistance. It would be an aggressive area for bears to hold but if we are, in fact, seeing carry unwind, then longs that have held for the dip below 150.00 could use that as opportunity to get out of the trade after a bounce. If we see sellers holding resistance there, I’d take that as a bearish indication.
A bit-higher is the 38.2% retracement of the recent bounce, and this was a price that had exhibited support on a couple of different occasions. Notably, it hasn’t yet functioned as resistance, so if we do see a spike above 150.00, that price at 151.51 is of interest, as is the 151.95 level lurking above it.
USD/JPY Four-Hour Chart
 Chart prepared by James Stanley; data derived from Tradingview
--- written by James Stanley, Senior Strategist
Japanese Yen Talking Points:
- USD/JPY traded below the 150.00 level for the first time since early-December.
- Indications continue to stack that the USD may have topped, and with both the USD and USD/JPY setting fresh lows today, the risk is a larger swell of Yen-strength leading into another carry unwind scenario, such as we saw last summer.
- While USD/JPY’s initial reaction to CPI last week was strength, the pair has sold off for five of the six past days, highlighting the shifting dynamic between rate expectations between the U.S. and Japan.
Ever since USD/JPY recovered back above the 150.00 level last October, there hasn’t been much time in the pair below that price. There was the test in early-December, but that was short-lived as bulls quickly came back, helped along by the FOMC meeting in the middle of that month that saw the pair make another run at the 160.00 handle.
But notably, ever since the US Dollar set its current high on January 13th, USD/JPY has taken on a new trend with a consistent series of lower-lows and highs. Today marks another waypoint along the way, as the pair has put in its first test below the 150.00 level in more than two months.
To be sure, these are difficult moves to chase, but given longer-term proximity to highs, there could be an opening for a continued sell-off, especially if the US Dollar reverts into its prior range.
USD/JPY Daily Chart
Chart prepared by James Stanley; data derived from Tradingview
USD/JPY Bigger Picture
The big question now is whether we’re at the forefront of another episode of carry unwind. Given the longer-term position of the pair, which remains well-elevated from the sub-103 levels that the trend had started at in early-2021, there’s likely a large remaining long position priced-in here.
Perhaps more important for equity markets, there’s probably a lot of leverage in markets outside of Japan that have been funded by the cheap rates furnished by Japanese banks. This is what led to the de-leveraging event last summer, when global equities began to fall as the USD/JPY carry trade unwound.
For institutions that had borrowed Yen at low rates in Japan and then invested it elsewhere, with a hedged position in USD/JPY, the falling spot rate served as a threat. And like we saw last summer, those positions can come off quickly as a crowded trade begins to unwind.
As is often the case across markets, the big driver is one of expectations, and if we are seeing a backdrop where the USD has topped, and where the Bank of Japan may be hiking rates, the motivation for holding long USD/JPY could continue to go down, and this is a likely culprit behind why USD/JPY is down about 6% from the January high while DXY is down by 3.45%, as of this writing.
Since the start of the carry trade back in 2021, there have been multiple episodes of bearish moves. In both November of 2022 and 2023, we saw stern sell-offs start and that’s even with the rate differential soundly favoring the long side of the pair.
Last summer’s sell-off is when that rate differential started to shift in the other direction, and similarly, this shocked longs as prices dropped by more than 2,000 pips in less than a month.
From the weekly chart below, it appears that another bearish leg has begun as the losses have been consistent with price dipping back-below the 150.00 handle.
USD/JPY Weekly Chart
Chart prepared by James Stanley; data derived from Tradingview
USD/JPY Near-Term
The breach of 150.00 could be indication that bears are getting more aggressive, but from a strategy standpoint, trader should still treat this cautiously, as there’ve been numerous twists and turns in the saga around USD/JPY over the past four years.
With price now below the 150.00 handle, that becomes a spot of possible lower-high resistance. It would be an aggressive area for bears to hold but if we are, in fact, seeing carry unwind, then longs that have held for the dip below 150.00 could use that as opportunity to get out of the trade after a bounce. If we see sellers holding resistance there, I’d take that as a bearish indication.
A bit-higher is the 38.2% retracement of the recent bounce, and this was a price that had exhibited support on a couple of different occasions. Notably, it hasn’t yet functioned as resistance, so if we do see a spike above 150.00, that price at 151.51 is of interest, as is the 151.95 level lurking above it.
USD/JPY Four-Hour Chart
Chart prepared by James Stanley; data derived from Tradingview
--- written by James Stanley, Senior Strategist
Related tags:
Latest market news




The complete CFD trading experience
Award-winning platforms, competitive spreads, low commissions and dedicated support.
We live and breathe the markets and are dedicated to helping traders realise their ambitions as we continue to set the industry bar.
Economic calendar
Web Trader platform
Our sophisticated web-based platform is packed with features.
Related articles
Gold Q4 2026 outlook: Resilience in the face of rallying dollar and yields
As we headed towards the latter stages of Q3 and into Q4, the Fed had just hiked rates in a hawkish FOMC meeting, while the likes of the ECB and BoJ had also tightened their respective policies. Oil prices remained elevated amid the prolonged US-Iran conflict. Meanwhile, bond yields were breaking out, and the dollar was higher across the board. Yet, remarkably, gold was still holding in the positive territory for the third quarter, even if it had weakened somewhat in September.
EUR/USD Q4 2026 Outlook: Euro at a Crossroads as Fed, ECB Tighten 9 25 2026
EUR/USD enters Q4 at a pivotal inflection point as competing Fed-ECB policy paths and persistent inflation risks collide with major technical support.

USD/JPY Q4 2026 Outlook: Hawkish Fed Pricing Clashes With Intervention Risk
The year-end tug-of-war is clear: hawkish Fed pricing supports USD/JPY, while intervention risk limits the upside.

StoneX Europe Ltd may make third party material available on this website which may contain information included but not limited to the conditions of financial markets. The material is for information purposes only and does not contain, and should not be construed as containing, investment advice and/or investment recommendation and/or an investment research and/or an offer of or solicitation for any transactions in financial instruments; any decision to enter into a specific transaction shall be made by the client following an assessment by him/her of their situation.
StoneX Europe Ltd makes no representation or warranty and assumes no liability as to the accuracy or completeness of the information provided, nor any loss arising from any investment based on a recommendation, forecast or other information supplied. You should always seek independent advice as to your suitability to speculate in any related markets and your ability to assume the associated risks, if you are at all unsure. We are not under any obligation to update any such material. Any opinion made may be personal to the author and may not reflect the opinion of StoneX Europe Ltd.