



Bitcoin Forecast: BTC shows weakness again and approaches 75k
Weaknesses have once again become the main driver in recent BTC price action. For now, the cryptocurrency has struggled to sustain consistent short-term demand and is posting a decline of nearly 2.00% during the session, moving back toward the 75k area.
Share this:

Weaknesses have once again become the main driver in recent BTC price action. For now, the cryptocurrency has struggled to sustain consistent short-term demand and is posting a decline of nearly 2.00% during the session, moving back toward the 75k area.
This dynamic reflects the risk of a relevant selling bias, mainly driven by a loss of market appetite. Significant outflows from Bitcoin ETFs and a decline in open positions suggest that demand for Bitcoin has started to weaken, possibly due to position liquidations and a macroeconomic environment that remains unfavorable for risk assets. As long as this behavior continues, selling pressure could remain relevant over the coming trading sessions.


Demand strength begins to fade
Since last week, Bitcoin ETFs have seen strong capital outflows. Every session last week recorded outflows, with May 18 standing out, when nearly $650 million left the ETF market. In total, weekly outflows exceeded $1 billion, reflecting a significant decline in short-term demand and a loss of appetite among market participants.
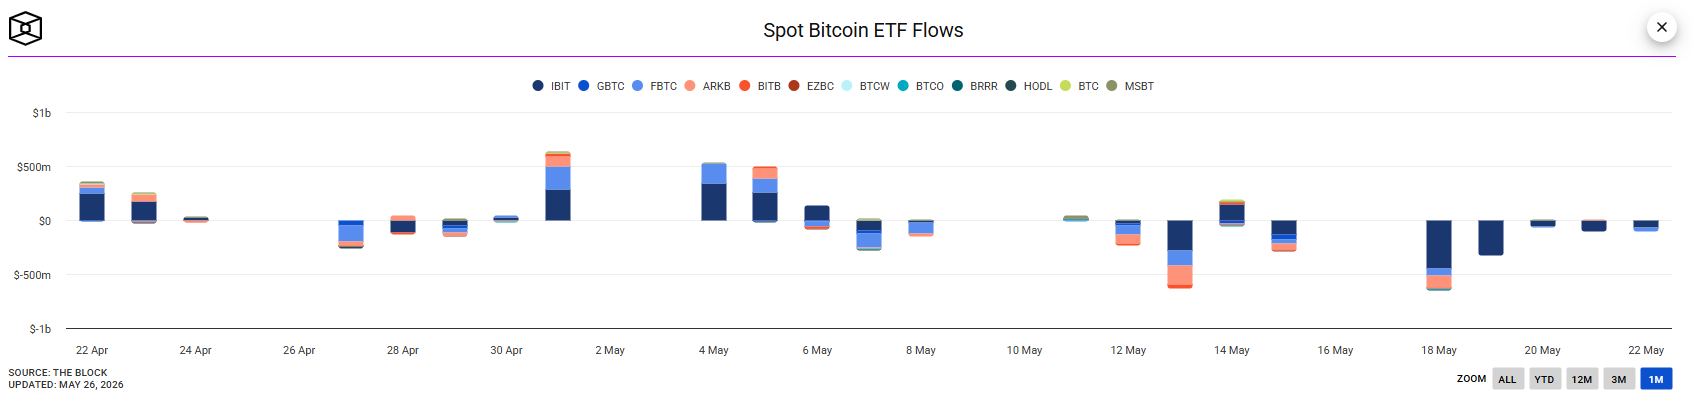
Source: theblock
This behavior is also visible in Open Interest, the indicator that measures the total number of open long and short positions in the Bitcoin market. Over the last few sessions, the indicator has maintained a downward slope and has moved closer to the $25 billion area, well below the May peak near $30 billion in open positions.
The decline in Open Interest reflects a relevant exit of market positions. In addition, as it coincides with the fall in BTC’s price, it suggests that a large part of these exits may be related to long positions. Together with negative ETF flows, this points to a weaker demand environment for Bitcoin in the short term.
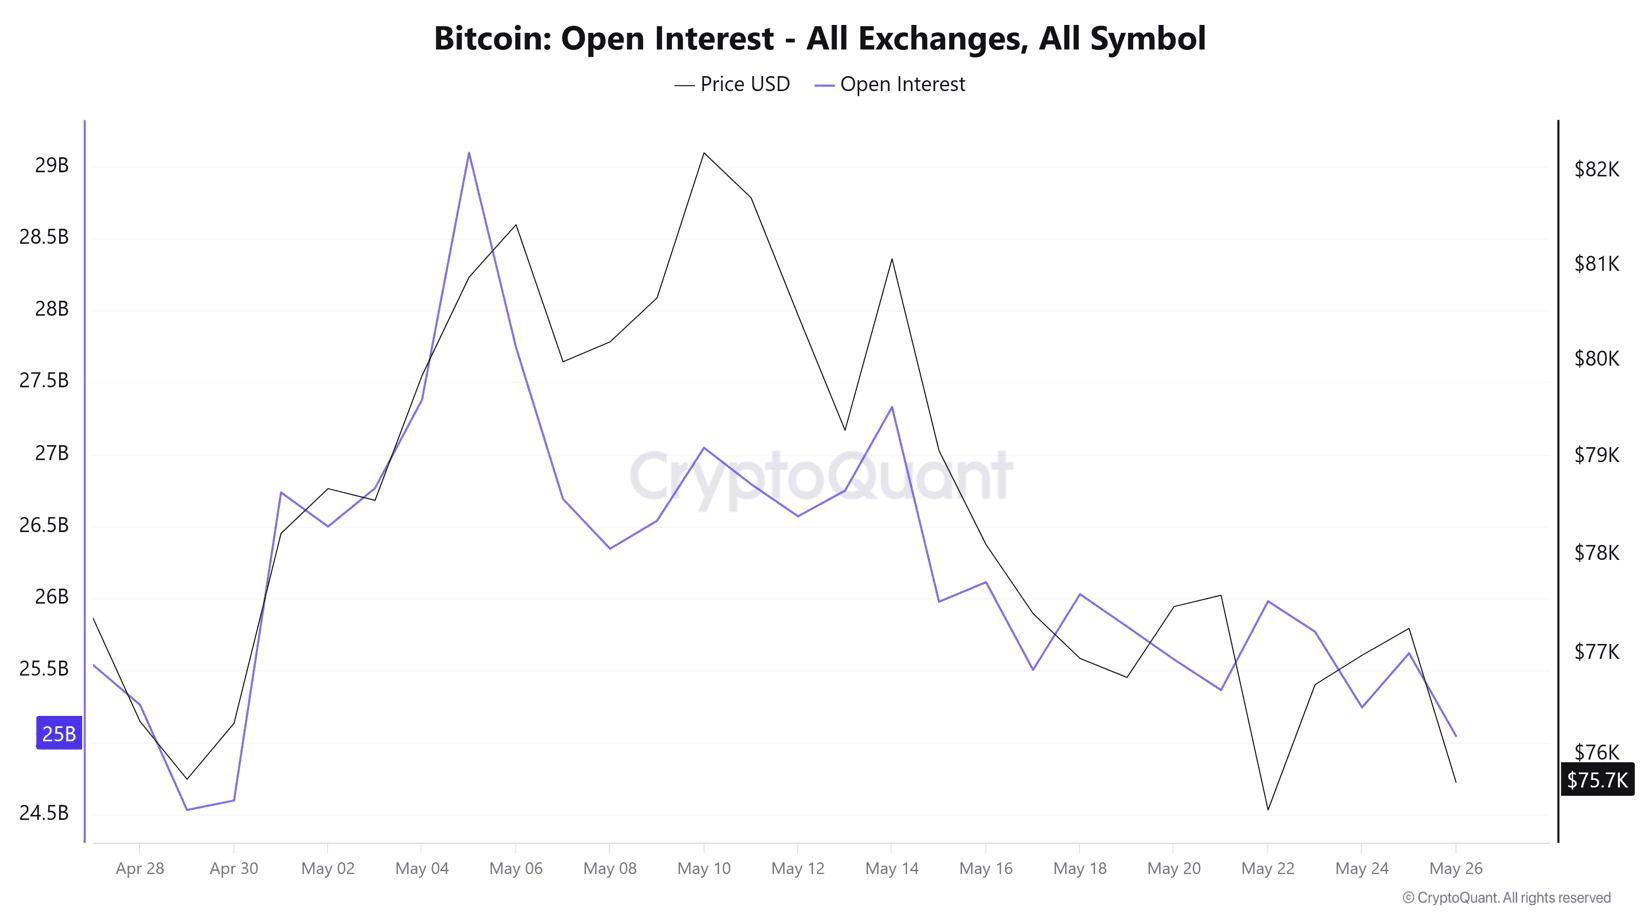
Source: Cryptoquant
The loss of activity around Bitcoin shows that market appetite continues to fade. This lack of confidence may be related to several factors: the absence of a clear peace agreement in the Middle East, the threat of higher rates for longer in the United States, and a possible liquidation of positions when price was trading near the 80k area.
These factors may be reducing the liquidity available for risk assets such as Bitcoin and affecting demand across both ETFs and Open Interest. Therefore, if global macroeconomic conditions do not become more favorable and BTC fails to hold relevant barrier zones, this loss of strength could continue to weigh on price over the coming trading sessions.
Market confidence fails to stabilize
Another relevant factor is the drop in crypto market confidence. The Crypto Fear and Greed Index has fallen toward the 37-point area, entering “fear” territory once again. This shows that confidence remains fragile and has not yet shown a clear recovery in recent trading sessions.
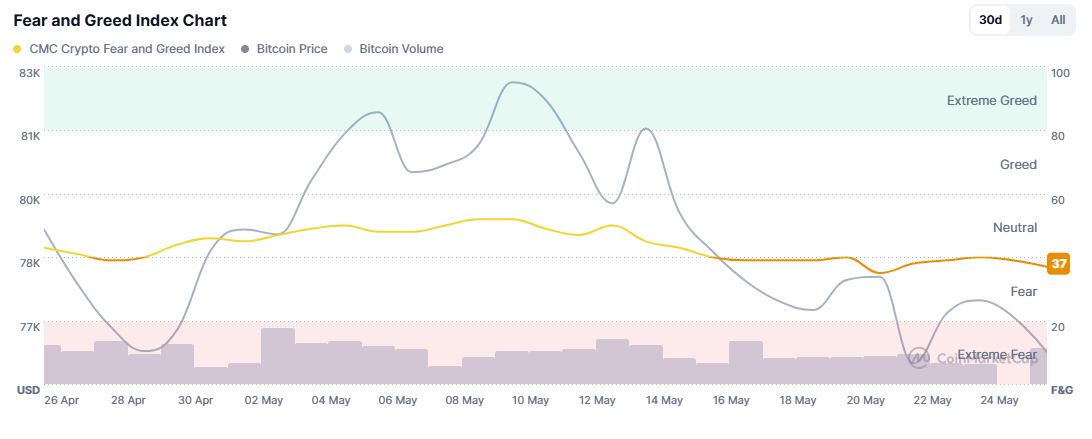
Source: Coinmarketcap
This behavior is important because, if market sentiment remains in negative territory, it will be difficult to build an optimal environment for consistent crypto demand in the short term. If the index continues to decline, it could indicate that market perception is still deteriorating, which may keep selling pressure on BTC during the coming sessions.
Technical outlook for Bitcoin
Source: StoneX, Tradingview
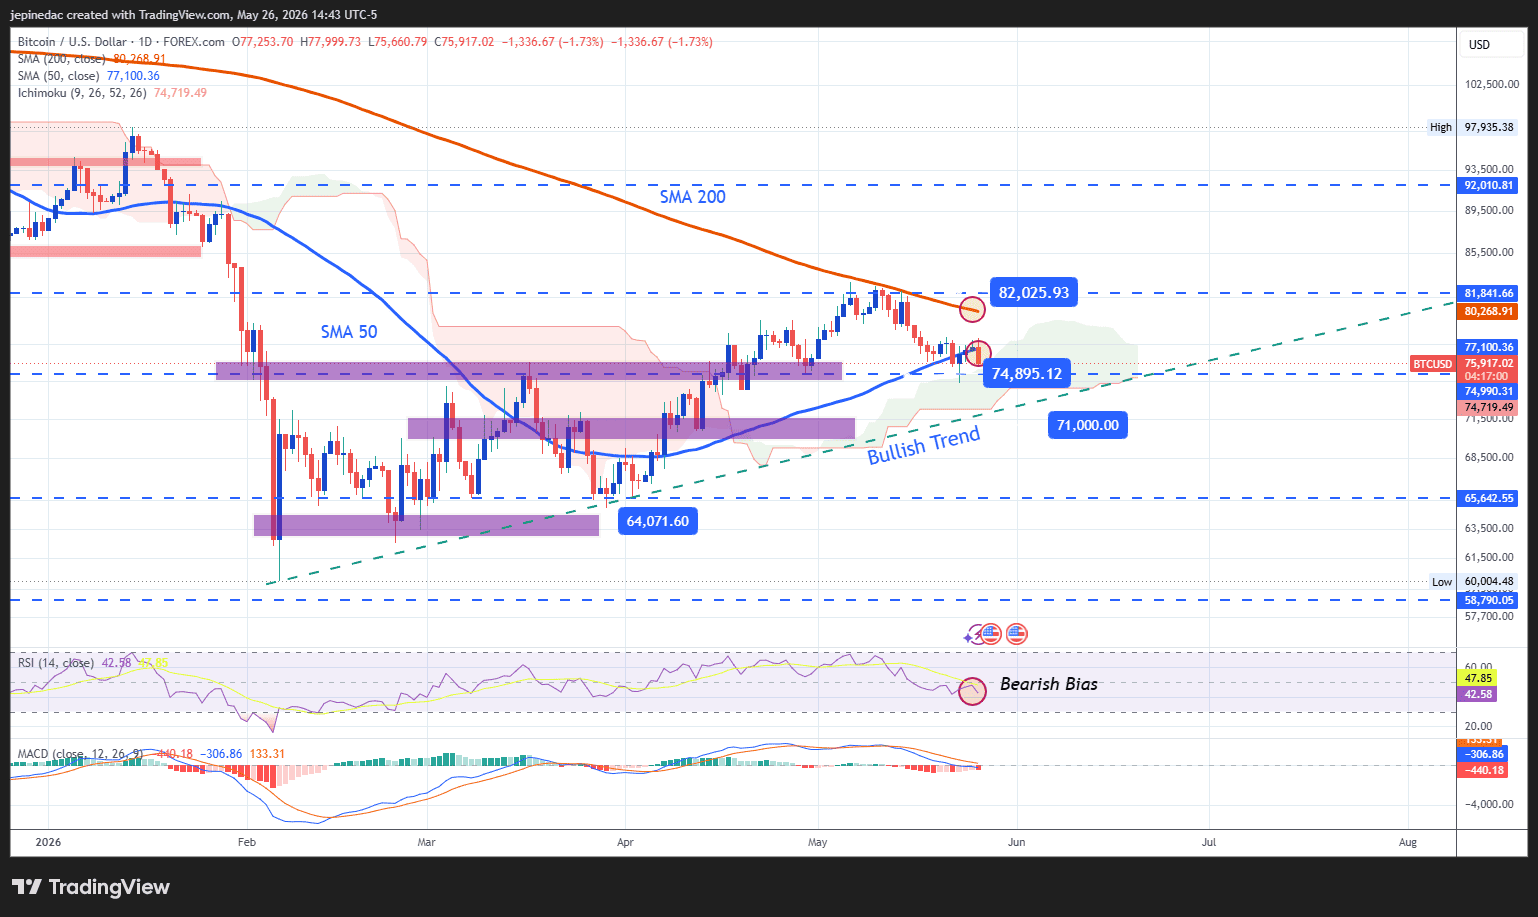
- New bullish trend begins to enter a risk zone: Over the past few weeks, BTC had shown a structure of higher lows, which opened the door to the possible formation of a new bullish trendline on the daily chart. However, buying strength has failed to hold, and price has moved back below the 50-period moving average. This move reflects a combination of short-term weakness and indecision. If this dynamic continues, the potential bullish trendline could come under pressure and open the door to a more relevant phase of neutrality over the coming sessions.
- MACD: Now, the MACD histogram is showing slight movements below the neutral 0 level, suggesting that the strength of short-term moving averages is starting to tilt toward bearish territory. If the indicator continues to decline, it could point to a more dominant selling bias in the short term.
- RSI: The RSI shows a similar scenario, as the indicator line remains below the 50 level. This indicates that short-term momentum is currently showing bearish dominance, which also highlights the possibility that selling pressure could continue for several sessions.
Key levels:
- 82,000 – Important resistance: A relevant high area that coincides with the 200-period moving average barrier. Moves toward this level could reinforce the dominance of the buying bias and, if broken with strength, open the door to a clearer extension of the short-term uptrend.
- 75,000 – Near-term barrier: A recent reference level that has acted as a retracement area in recent sessions and coincides with the 50-period simple moving average. Price action that remains too close to this level could intensify a phase of consistent indecision and even open the door to the formation of a sideways range in the market.
- 71,000 – Definitive support: An area located below the 50-period moving average, currently standing as the most relevant downside barrier. Moves toward this level could reactivate dominant selling pressure, put an end to the current potential bullish trendline, and intensify a more consistent selling bias over the coming weeks.
Written by Julian Pineda, CFA, CMT – Market Analyst
Follow him on: @julianpineda25



The complete CFD trading experience
Award-winning platforms, competitive spreads, low commissions and dedicated support.
We live and breathe the markets and are dedicated to helping traders realise their ambitions as we continue to set the industry bar.
Economic calendar
Web Trader platform
Our sophisticated web-based platform is packed with features.
Related articles

Bitcoin Forecast: BTC/USD Bounces off $80K, 9-Month Highs In Play?
Despite apparent fundamental headwinds, Bitcoin’s price has held up relatively well, bouncing sharply off $80K support - where could it head next?


Bitcoin Analysis: Caution Keeps BTC Below $85K
Despite Bitcoin's attempt to regain ground during the latest trading session, posting gains of more than 1.6%, the move has yet to signal a meaningful recovery in demand. The main reason is that, over recent weeks, price action has continued to develop within a broader phase of indecision, preventing BTC from reclaiming the key psychological barrier around $85,000 in a convincing manner.

BTC/USD: Dead-cat bounce or the start of another recovery?
Bitcoin has bounced aggressively after another test of its 50-day moving average, but tech futures remain under pressure. With equity correlations strengthening and bearish momentum building, can BTC/USD sustain the recovery?

StoneX Europe Ltd may make third party material available on this website which may contain information included but not limited to the conditions of financial markets. The material is for information purposes only and does not contain, and should not be construed as containing, investment advice and/or investment recommendation and/or an investment research and/or an offer of or solicitation for any transactions in financial instruments; any decision to enter into a specific transaction shall be made by the client following an assessment by him/her of their situation.
StoneX Europe Ltd makes no representation or warranty and assumes no liability as to the accuracy or completeness of the information provided, nor any loss arising from any investment based on a recommendation, forecast or other information supplied. You should always seek independent advice as to your suitability to speculate in any related markets and your ability to assume the associated risks, if you are at all unsure. We are not under any obligation to update any such material. Any opinion made may be personal to the author and may not reflect the opinion of StoneX Europe Ltd.