



Bitcoin Forecast: BTC/USD -30% From Highs – When Will the Selling Stop?
Bitcoin is in the midst of a -30% correction off the intraday high, with little in the way of direct news driving the cryptocurrency lower - what are the next levels to watch?
Share this:

Bitcoin Key Points
- Bitcoin is in the midst of a -30% correction off the intraday high, with little in the way of direct news driving the cryptocurrency lower.
- Bitcoin ETFs have seen substantial outflows on all but four days this month, with total outflows nearing -$3B so far
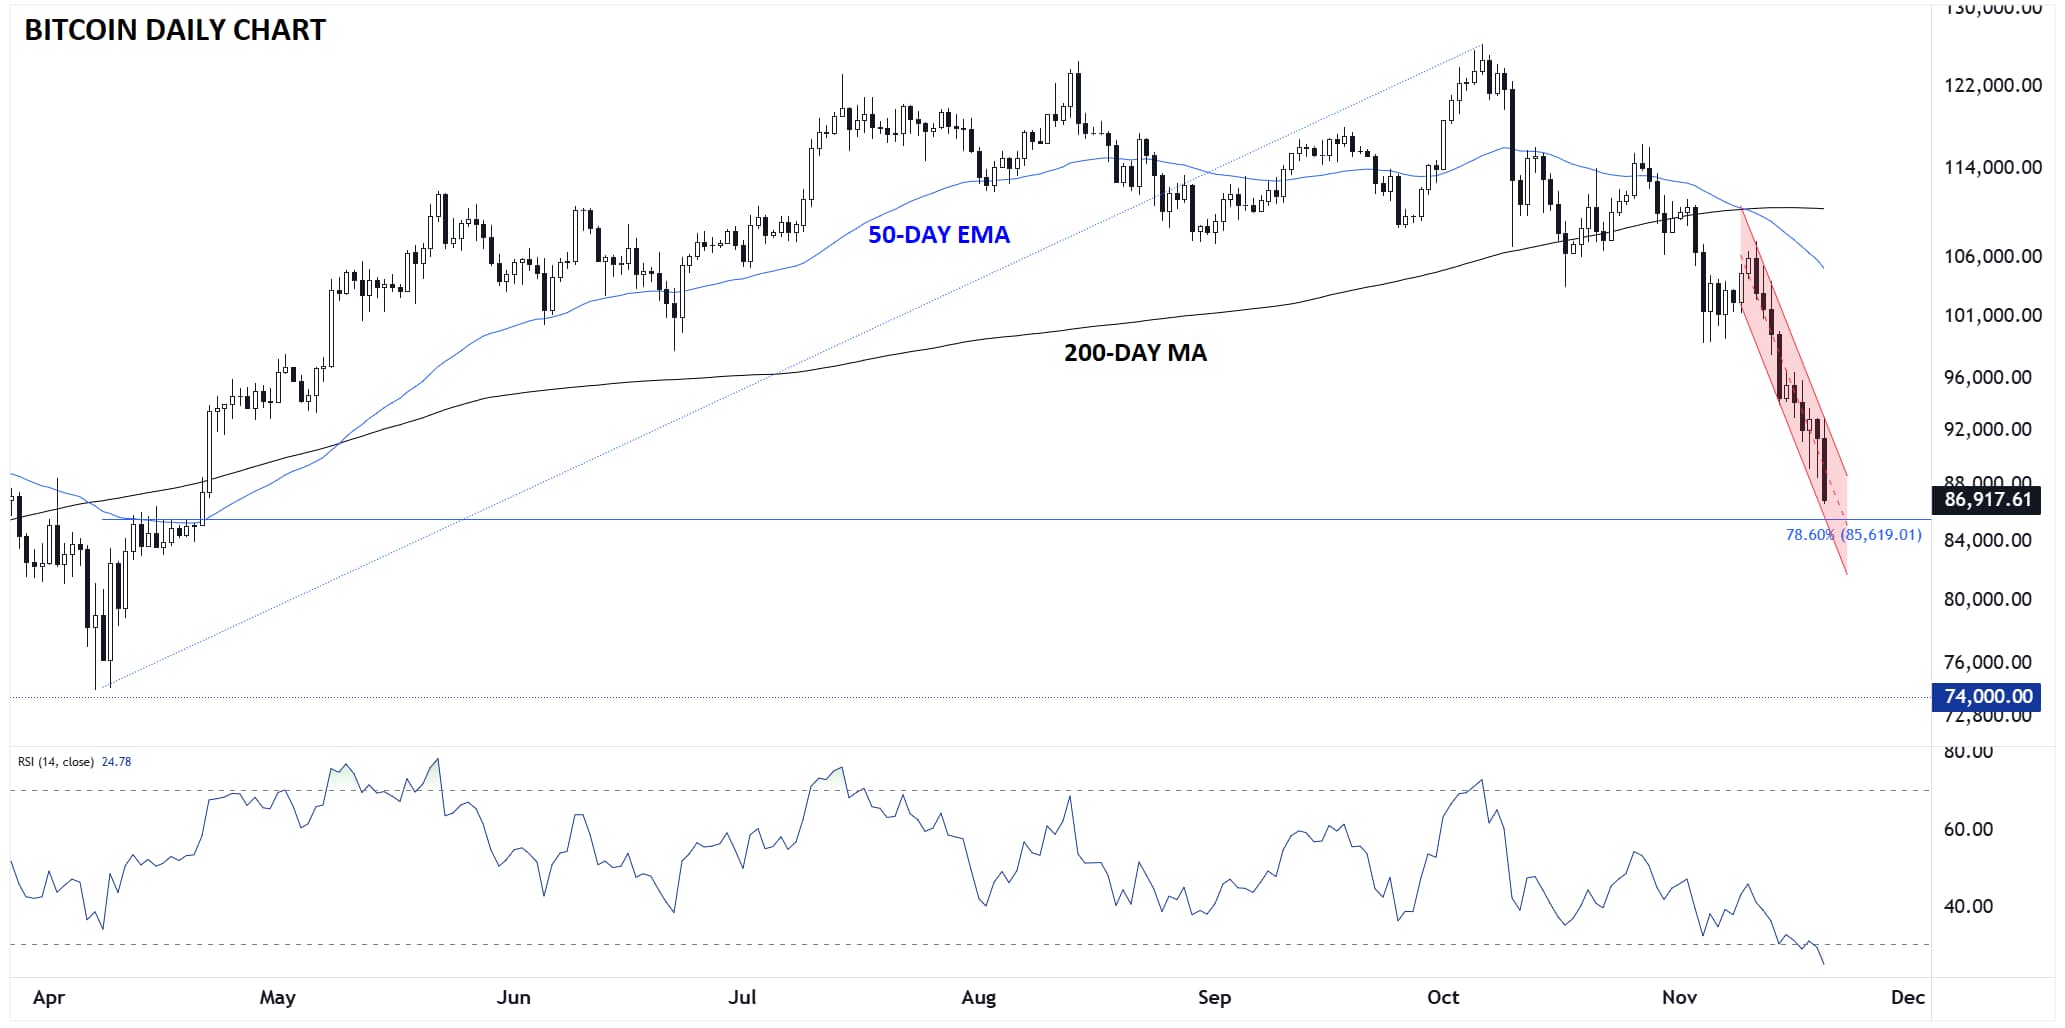
- The next downside levels to watch are near $85,600 (the 78.6% retracement of the Q2-3 rally), and the 1-year low near $74,000.
Among the retail crowd, Bitcoin had its big moment back around Thanksgiving 2017, when the proverbial tech-savvy millennials pitched/annoyed their older family members by regaling them with the benefits of digital currencies as the cryptocurrency crossed $10K for the first time. Bitcoin is now trading about 9X higher than it was eight years ago, but this Thanksgiving, digital asset evangelists will be a bit quieter.
Bitcoin is in the midst of a -30% correction off the intraday high, with little in the way of direct news driving the cryptocurrency lower. In a classic “be careful what you wish for” scenario, the introduction of Bitcoin ETFs has opened the door for large institutional flows that drove Bitcoin sharply higher over the past two years…but when investors get skittish, the corresponding outflows can weigh heavily on price. As the table below shows, Bitcoin ETFs have seen substantial outflows on all but four days this month, with total outflows nearing -$3B so far:
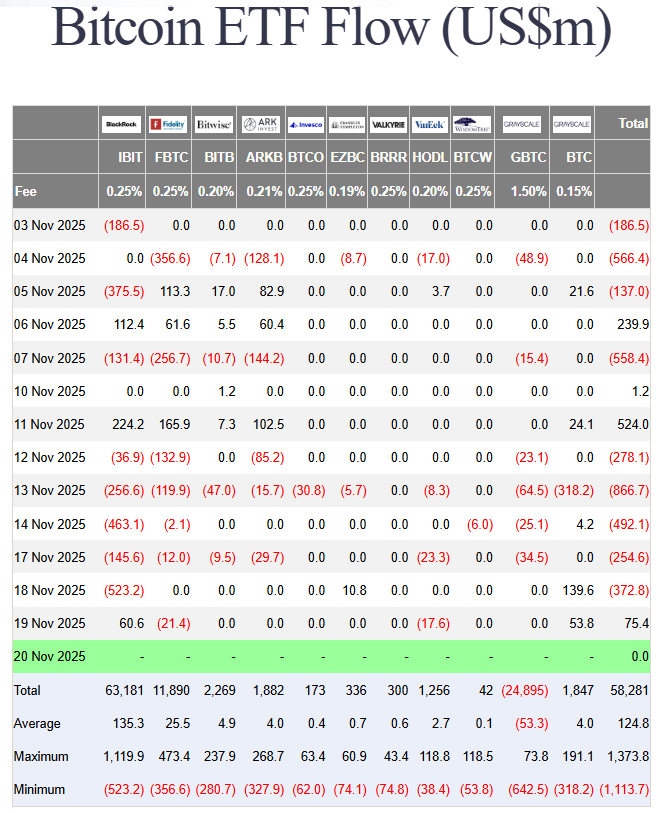
Source: Farside Investors
Fundamentally speaking, the outflows have been driven in part by fading expectations of a December rate cut from the Federal Reserve (and the corresponding strength in the US dollar), but with rate cuts odds edging higher after the mixed NFP report today, that clearly doesn’t tell the whole story. Ultimately, the sentiment tide has turned on Bitcoin, and unless/until we start see improving price action and fundamental factors, traders will remain in “sell rallies” mode as a default.
Bitcoin Technical Analysis: BTC/USD Daily Chart
Source: StoneX, TradingView
As the chart above shows, Bitcoin is in the midst of a brutal downdraft. Since peeking out to a record high above $126K in early October, the cryptocurrency has fallen a full -30% to trade below $89K as we go to press. If anything, the selloff has accelerated in the last couple of weeks, with -17% of that drop occurring in the last nine days alone.
The 14-day RSI indicator in the subpanel shows that Bitcoin is currently “oversold,” though that’s not necessarily a sign that we’ll see a bounce any time soon, especially with no technical support until the 78.6% Fibonacci retracement below $86K. If that level gives way, the next level to watch will be the 1-year lows near $74K. At this point, traders will continue to sell near-term bounces in the cryptocurrency until it can break out of its bearish channel, and even then, it would likely need to carve out a “higher low” before dip buyers get more constructive.
-- Written by Matt Weller, Global Head of Research
Check out Matt’s Daily Market Update videos on YouTube and be sure to follow Matt on Twitter: @MWellerFX
Related tags:


The complete CFD trading experience
Award-winning platforms, competitive spreads, low commissions and dedicated support.
We live and breathe the markets and are dedicated to helping traders realise their ambitions as we continue to set the industry bar.
Economic calendar
Web Trader platform
Our sophisticated web-based platform is packed with features.
Related articles
Bitcoin Analysis: Is Uncertainty Returning to BTC?
Recent trading sessions have not been particularly supportive of a clear directional move in Bitcoin. This can be seen in the behavior of the price over the last four sessions, where fluctuations have remained close to 1.00% without establishing a consistent trend. As a result, a growing sense of neutrality is beginning to emerge around BTC.

US Core PCE Preview: Stale or Significant for the Fed
Core PCE inflation takes center stage Wednesday, with traders watching for signs of renewed price pressure and clues on whether the Fed could hike again in October.

Australian Dollar Forecast: AUD/USD Four-Week Slide Nears Critical Uptrend Support 9 29 2026
Aussie momentum has deteriorated sharply into quarter-end, with inflation, Core PCE and NFP on tap as AUD/USD closes in on a pivotal technical threshold.

StoneX Europe Ltd may make third party material available on this website which may contain information included but not limited to the conditions of financial markets. The material is for information purposes only and does not contain, and should not be construed as containing, investment advice and/or investment recommendation and/or an investment research and/or an offer of or solicitation for any transactions in financial instruments; any decision to enter into a specific transaction shall be made by the client following an assessment by him/her of their situation.
StoneX Europe Ltd makes no representation or warranty and assumes no liability as to the accuracy or completeness of the information provided, nor any loss arising from any investment based on a recommendation, forecast or other information supplied. You should always seek independent advice as to your suitability to speculate in any related markets and your ability to assume the associated risks, if you are at all unsure. We are not under any obligation to update any such material. Any opinion made may be personal to the author and may not reflect the opinion of StoneX Europe Ltd.