



Bitcoin Outlook: BTC/USD Looked Shaky Even Before Tariff Shock
Bitcoin’s latest pullback may have been triggered by Trump’s tariff threat, but the warning signs were already flashing well before the headlines hit.
Share this:

- BTC/USD showed topping patterns before the tariff news
- Momentum indicators shifting neutral bearish across daily and weekly charts
- Selling rallies preferred in prevailing environment
Has Donald Trump’s threat to impose additional 100% tariffs on Chinese imports from November 1 in retaliation to Beijing’s decision to implement export controls on rare earth minerals provided a catalyst to spark meaningful downside in Bitcoin and other crypto assets? Looking at the price action leading up to and following Trump’s Truth Social post late Friday, it’s easy to make the case.
BTC/USD Looked Suspect Before Tariff News
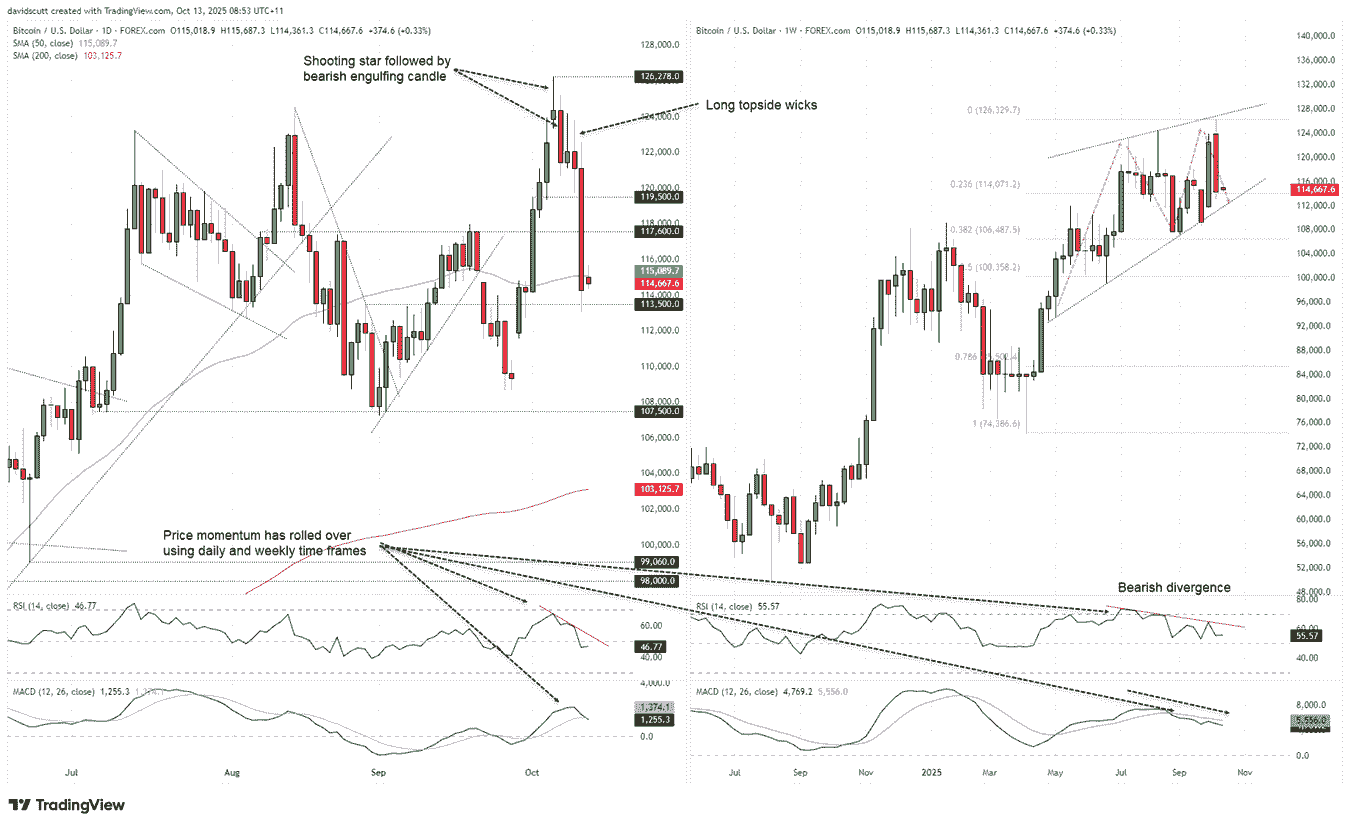
The chart below has two panes. On the left, it’s BTC/USD using a daily timeframe. On the right, it’s BTC/USD using a weekly tick. Both show notable topping patterns, warning that calls for another quick ‘TACO’ turnaround for riskier asset classes may be anything but guaranteed, especially following the scale of the surge seen since markets bottomed in early April following the Liberation Day reciprocal tariff announcement.
Source: TradingView
On the daily chart, we can see an obvious shooting star candle last Monday that printed after establishing a fresh record high. It was then followed by a bearish engulfing candle a day later, with the subsequent candles prior to Friday’s wipeout all notable for their extended topside wicks. The broader message was therefore one of bears gaining the upper hand in BTC/USD even before the latest tariff headlines struck.
Momentum indicators back this view up. RSI (14) is trending lower and is now below 50, providing a neutral to slightly bearish message on near-term directional risks. And while MACD remains in positive territory, it has already crossed the signal line from above and is also pushing lower, adding to the sense that selling rips may be preferable to buying dips in the current environment.


Bolstering the increasingly bearish message from the daily chart, the price action on the weekly has also been unconvincing for the bulls. Last week’s dark cloud cover pattern warned of a change in directional risks, gapping higher to fresh highs upon the open before reversing hard into the close. The reversal pattern is complemented by the rising wedge BTC/USD has been coiling in over the past six months, warning of the potential for an eventual downside break. Add in bearish divergence with RSI (14) and a bearish crossover in MACD, and the short- and medium-term price and momentum signals are hard to ignore, even though the longer-term trend remains undeniably bullish.
As for levels to consider for trade entry and exits, on the topside we saw sellers active above $124,000 for larger periods last week, making that a zone of interest for bears looking to establish shorts or bulls seeking to square from either existing or fresh longs.
On the downside, $113,500–$114,000 is a zone worth watching, comprising the 23.6% fib retracement of the April–October low-high and former horizontal resistance which acted as support on the last two times of testing, including on Friday. Should this zone give way, support at $107,500 and the psychologically important $100,000 level provide opportunities for trade exit and entry.


The complete CFD trading experience
Award-winning platforms, competitive spreads, low commissions and dedicated support.
We live and breathe the markets and are dedicated to helping traders realise their ambitions as we continue to set the industry bar.
Economic calendar
Web Trader platform
Our sophisticated web-based platform is packed with features.
Related articles

Nikkei breakout accelerates as yen weakness returns
Nikkei has started October with a powerful breakout, helped by renewed yen weakness and strong upside momentum

AUD/USD hammered by US yields and fading RBA hike bets
US yields, dollar strength and fading RBA hike bets have combined to drive AUD/USD to fresh multi-month lows. The macro and technical bias remains bearish, although history suggests parts of the move are now reaching unusually stretched levels.

Canadian Dollar Forecast: USD/CAD Four-Week Rally Eyes Yearly Highs 9 30 2026
USD/CAD has advanced in 14 of the past 15 sessions, but stretched momentum raises the stakes as major resistance and NFP come into focus.

StoneX Europe Ltd may make third party material available on this website which may contain information included but not limited to the conditions of financial markets. The material is for information purposes only and does not contain, and should not be construed as containing, investment advice and/or investment recommendation and/or an investment research and/or an offer of or solicitation for any transactions in financial instruments; any decision to enter into a specific transaction shall be made by the client following an assessment by him/her of their situation.
StoneX Europe Ltd makes no representation or warranty and assumes no liability as to the accuracy or completeness of the information provided, nor any loss arising from any investment based on a recommendation, forecast or other information supplied. You should always seek independent advice as to your suitability to speculate in any related markets and your ability to assume the associated risks, if you are at all unsure. We are not under any obligation to update any such material. Any opinion made may be personal to the author and may not reflect the opinion of StoneX Europe Ltd.