





Canadian Dollar Forecast: USD/CAD Breaks Down from 1.4000 Rejection
USD/CAD showed a clean test of the 1.4000 handle last week and sellers went on attack as USD weakness came back online.
Share this:

Canadian Dollar, USD/CAD Talking Points:
- U.S. Dollar weakness is back this week and the market that I’ve been tracking for that theme has been USD/CAD.
- The pair put in a clean hold of the 1.4000 level with zero daily closes above that price, and as DXY sellers came back USD/CAD dropped by more than 200 pips from last week’s highs.
- The longer-term range in USD/CAD remains attractive and this can keep the pair as a venue for USD-weakness scenarios.
USD/CAD has traded lower every day this week on the heels of last week’s resistance at the 1.4000 psychological level. This was a big zone and a price that I had been highlighting as resistance potential for some time. After the swing high on Tuesday the 13th, it produced a series of lower-highs with the 1.4000 price holding the highs after, and this week sellers were able to stretch as short-term support was breached and USD/CAD fell towards 2025 lows.
USD/CAD Daily Chart

Chart prepared by James Stanley; data derived from Tradingview
USD/CAD Bigger Picture
It’s been a bearish outlay for the USD so far this year and that is in stark contrast to the strength that the currency was showing as it came into 2025. And at this point there’s now the threat or possibility of a greater show of carry unwind in USD/JPY, which could drive more weakness into the currency.
If we do get that scenario of considerable USD-weakness, USD/CAD remains an attractive venue for bearish continuation, as the decade-long range remains intact even after the flare of strength earlier in the year.
Notably – bulls couldn’t hold the move above 1.4500 for long, and prices soon dipped down below 1.4000 in April. Since then, sellers have defended that price and the door remains open to longer-term range continuation in the pair.
USD/CAD Weekly Price Chart
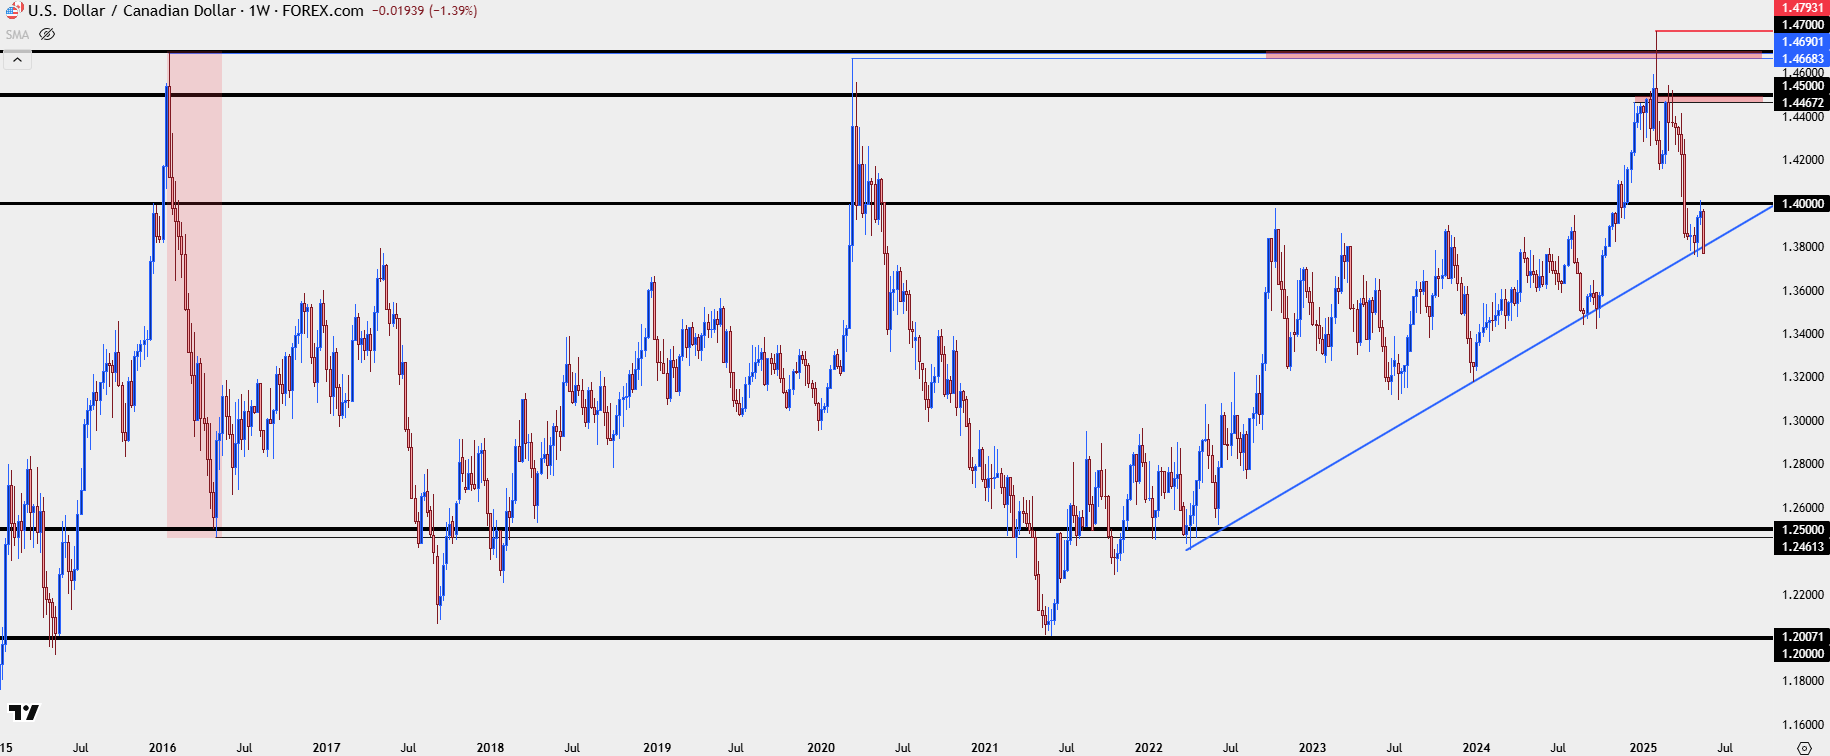 Chart prepared by James Stanley; data derived from Tradingview
USD/CAD Shorter-Term Strategy
USD/CAD is in the process of breakdown right now and the pair is fast approaching its 2025 low at the 1.3750 psychological level. That can be a tough move to chase, but for USD-bears, this would keep the door open for breakdown themes.
For those looking to play pullbacks, there’s an aggressive spot of lower-high resistance potential at 1.3781 and another slightly less-aggressive level at 1.3813, which had showed as support briefly earlier in the week. Above that, I’m tracking a zone from 1.3890 up to 1.3905, and ideally this is the resistance that bears would hold in deeper pullback scenarios in order to retain control.
USD/CAD Four-Hour Chart
 Chart prepared by James Stanley; data derived from Tradingview
--- written by James Stanley, Senior Strategist
Canadian Dollar, USD/CAD Talking Points:
- U.S. Dollar weakness is back this week and the market that I’ve been tracking for that theme has been USD/CAD.
- The pair put in a clean hold of the 1.4000 level with zero daily closes above that price, and as DXY sellers came back USD/CAD dropped by more than 200 pips from last week’s highs.
- The longer-term range in USD/CAD remains attractive and this can keep the pair as a venue for USD-weakness scenarios.
USD/CAD has traded lower every day this week on the heels of last week’s resistance at the 1.4000 psychological level. This was a big zone and a price that I had been highlighting as resistance potential for some time. After the swing high on Tuesday the 13th, it produced a series of lower-highs with the 1.4000 price holding the highs after, and this week sellers were able to stretch as short-term support was breached and USD/CAD fell towards 2025 lows.
USD/CAD Daily Chart
Chart prepared by James Stanley; data derived from Tradingview
USD/CAD Bigger Picture
It’s been a bearish outlay for the USD so far this year and that is in stark contrast to the strength that the currency was showing as it came into 2025. And at this point there’s now the threat or possibility of a greater show of carry unwind in USD/JPY, which could drive more weakness into the currency.
If we do get that scenario of considerable USD-weakness, USD/CAD remains an attractive venue for bearish continuation, as the decade-long range remains intact even after the flare of strength earlier in the year.
Notably – bulls couldn’t hold the move above 1.4500 for long, and prices soon dipped down below 1.4000 in April. Since then, sellers have defended that price and the door remains open to longer-term range continuation in the pair.
USD/CAD Weekly Price Chart
USD/CAD Shorter-Term Strategy
USD/CAD is in the process of breakdown right now and the pair is fast approaching its 2025 low at the 1.3750 psychological level. That can be a tough move to chase, but for USD-bears, this would keep the door open for breakdown themes.
For those looking to play pullbacks, there’s an aggressive spot of lower-high resistance potential at 1.3781 and another slightly less-aggressive level at 1.3813, which had showed as support briefly earlier in the week. Above that, I’m tracking a zone from 1.3890 up to 1.3905, and ideally this is the resistance that bears would hold in deeper pullback scenarios in order to retain control.
USD/CAD Four-Hour Chart
--- written by James Stanley, Senior Strategist
Related tags:
Latest market news




The complete CFD trading experience
Award-winning platforms, competitive spreads, low commissions and dedicated support.
We live and breathe the markets and are dedicated to helping traders realise their ambitions as we continue to set the industry bar.
Economic calendar
Web Trader platform
Our sophisticated web-based platform is packed with features.
Related articles
Canadian Dollar Forecast: USD/CAD Four-Week Rally Eyes Yearly Highs 9 30 2026
USD/CAD has advanced in 14 of the past 15 sessions, but stretched momentum raises the stakes as major resistance and NFP come into focus.

Nasdaq Breakout Potential into Q4 for Melt Up Scenarios
The headlines seem negative in almost any place that you look, with surging Treasury yields and frothy AI valuations getting more and more attention. But, if it’s so bad, why hasn’t the Nasdaq melted down yet, even as the Fed has started hiking rates?

The RBA Hiked Rates and the Australian Dollar Still Fell
AUD/USD fell after the RBA rate hike because the central bank's hawkish stance was already priced in while the U.S. dollar stayed firm.

StoneX Europe Ltd may make third party material available on this website which may contain information included but not limited to the conditions of financial markets. The material is for information purposes only and does not contain, and should not be construed as containing, investment advice and/or investment recommendation and/or an investment research and/or an offer of or solicitation for any transactions in financial instruments; any decision to enter into a specific transaction shall be made by the client following an assessment by him/her of their situation.
StoneX Europe Ltd makes no representation or warranty and assumes no liability as to the accuracy or completeness of the information provided, nor any loss arising from any investment based on a recommendation, forecast or other information supplied. You should always seek independent advice as to your suitability to speculate in any related markets and your ability to assume the associated risks, if you are at all unsure. We are not under any obligation to update any such material. Any opinion made may be personal to the author and may not reflect the opinion of StoneX Europe Ltd.