





Canadian Employment data beats HUGELY
The Canadian employment data helped to provide further evidence of the BOC's outlook.
Share this:

After the less dovish Bank of Canada meeting on Wednesday in which Tiff Macklem said that the outlook on Q1 GDP will be revised higher, the Canadian employment data helped to provide further evidence of the central bank’s outlook. The Canadian employment change for February was +259,200 vs an expectation of +75,000. For January, the print remained unchanged at -212,800. The Unemployment Rate also dropped from 9.2% to 8.2%! Part-time jobs did outpace fulltime jobs at 171,000 vs 88,200, however no matter how you dissect these numbers, they are stronger than economist anticipated.
Forex market hours: when is the best time of day to trade forex?
USD/CAD has been selling off since the pandemic highs on March 18th in an orderly descending wedge formation. Interestingly, many of the US Dollar pairs have been moving higher as of late. However, USD/CAD is not one of them. The pair is currently pushing lower towards the bottom trendline of the descending wedge and February 25th lows.
Soruce: Tradingview, City Index
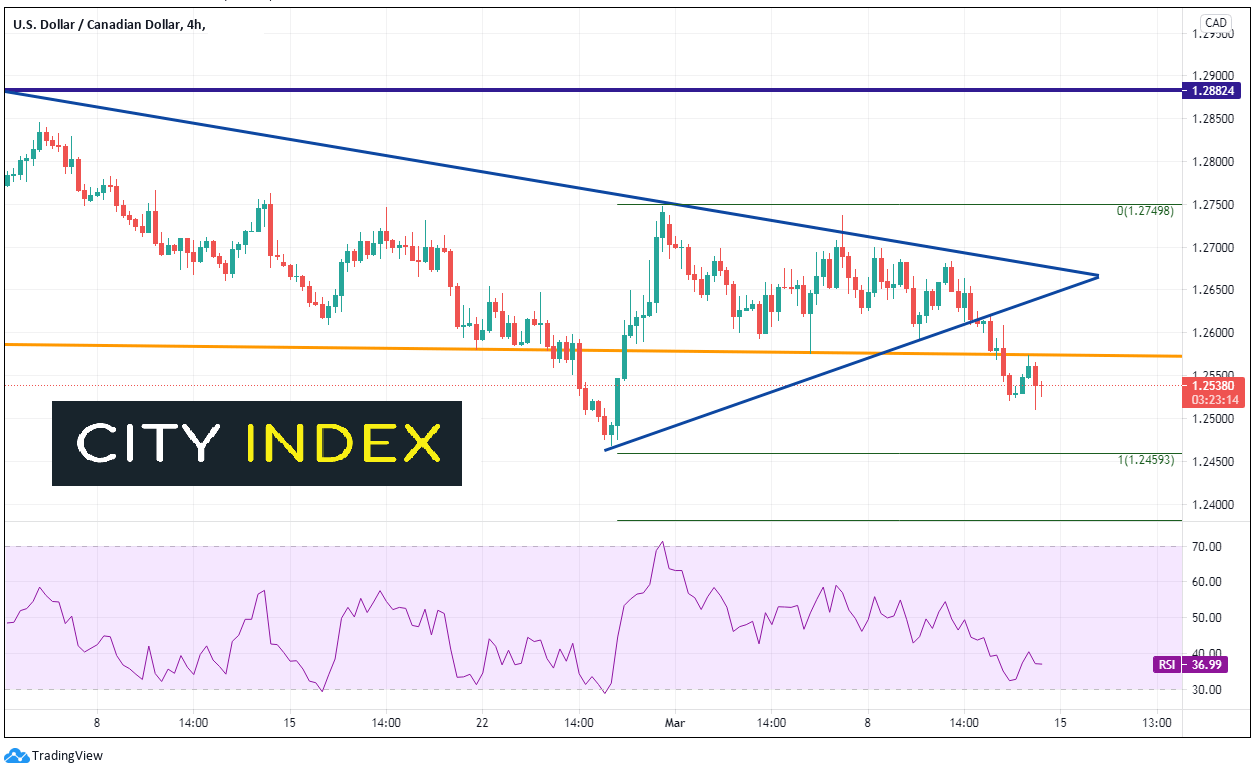
On a 240-minute timeframe, USD/CAD moved aggressively higher off the lows on February 25th on the heels of a weak 7-year auction. However, price only bounced to the downward sloping trendline dating back to October 29th, 2020. The resistance held and the pair resumed its move lower. Price broke lower out of a symmetrical triangle on March 11th and may be resuming the longer-term trend, on its way to testing the February 25th low at 1.2468, which acts as the first level of support. If price breaks below there, support is at the 127.2% and 161.8% Fibonacci extensions from the February 25th lows to the February 26th highs at 1.2380 and 1.2280, respectively. The next level of support isn’t until the September 2017 lows near 1.2061! However, if the US Dollar can strength against the Canadian Dollar, resistance is at the bottom level of the symmetrical triangle near 1.2634 and then the upper, longer term trendline from November 2020 near 1.2680. The next level of resistance is at the February 26th highs near 1.2748.
Source: Tradingview, City Index
At this point, there is much more resistance, near-term, than support. If the data continues to be strong out of Canada, USD/CAD may be headed lower. In addition, stronger crude oil prices will help support the strong Canadian Dollar, causing USD/CAD to move lower. However, the US data hasn’t been that weak either, especially in terms of inflation expectations, employment data, and the vaccine rollout. These may act as an incentive for the Fed to reduce tapering “earlier than expected”, which would cause the US Dollar to rise, and may bring USD/CAD with it (see: Are 10-year yields driving US Dollar pairs?). Regardless of what the US data shows, this Canadian employment data was strong!
Learn more about forex trading opportunities.
After the less dovish Bank of Canada meeting on Wednesday in which Tiff Macklem said that the outlook on Q1 GDP will be revised higher, the Canadian employment data helped to provide further evidence of the central bank’s outlook. The Canadian employment change for February was +259,200 vs an expectation of +75,000. For January, the print remained unchanged at -212,800. The Unemployment Rate also dropped from 9.2% to 8.2%! Part-time jobs did outpace fulltime jobs at 171,000 vs 88,200, however no matter how you dissect these numbers, they are stronger than economist anticipated.
Forex market hours: when is the best time of day to trade forex?
USD/CAD has been selling off since the pandemic highs on March 18th in an orderly descending wedge formation. Interestingly, many of the US Dollar pairs have been moving higher as of late. However, USD/CAD is not one of them. The pair is currently pushing lower towards the bottom trendline of the descending wedge and February 25th lows.
Soruce: Tradingview, FOREX.com
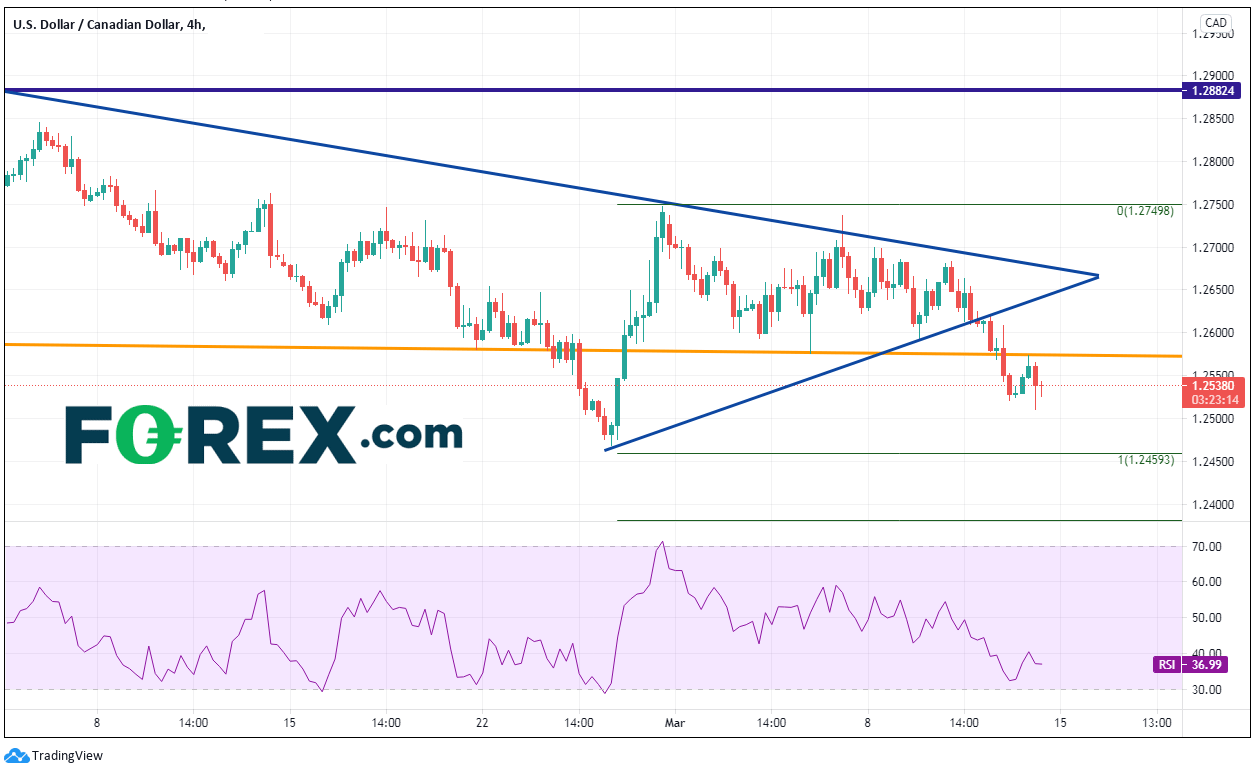
On a 240-minute timeframe, USD/CAD moved aggressively higher off the lows on February 25th on the heels of a weak 7-year auction. However, price only bounced to the downward sloping trendline dating back to October 29th, 2020. The resistance held and the pair resumed its move lower. Price broke lower out of a symmetrical triangle on March 11th and may be resuming the longer-term trend, on its way to testing the February 25th low at 1.2468, which acts as the first level of support. If price breaks below there, support is at the 127.2% and 161.8% Fibonacci extensions from the February 25th lows to the February 26th highs at 1.2380 and 1.2280, respectively. The next level of support isn’t until the September 2017 lows near 1.2061! However, if the US Dollar can strength against the Canadian Dollar, resistance is at the bottom level of the symmetrical triangle near 1.2634 and then the upper, longer term trendline from November 2020 near 1.2680. The next level of resistance is at the February 26th highs near 1.2748.
Source: Tradingview, Forex.com
At this point, there is much more resistance, near-term, than support. If the data continues to be strong out of Canada, USD/CAD may be headed lower. In addition, stronger crude oil prices will help support the strong Canadian Dollar, causing USD/CAD to move lower. However, the US data hasn’t been that weak either, especially in terms of inflation expectations, employment data, and the vaccine rollout. These may act as an incentive for the Fed to reduce tapering “earlier than expected”, which would cause the US Dollar to rise, and may bring USD/CAD with it (see: USD/CHF and USD/JPY). Regardless of what the US data shows, this Canadian employment data was strong!
Learn more about forex trading opportunities.
Latest market news




The complete CFD trading experience
Award-winning platforms, competitive spreads, low commissions and dedicated support.
We live and breathe the markets and are dedicated to helping traders realise their ambitions as we continue to set the industry bar.
Economic calendar
Web Trader platform
Our sophisticated web-based platform is packed with features.
Related articles
EUR/USD Q4 2026 Outlook: Euro at a Crossroads as Fed, ECB Tighten 9 25 2026
EUR/USD enters Q4 at a pivotal inflection point as competing Fed-ECB policy paths and persistent inflation risks collide with major technical support.
USD/JPY Q4 2026 Outlook: Hawkish Fed Pricing Clashes With Intervention Risk
The year-end tug-of-war is clear: hawkish Fed pricing supports USD/JPY, while intervention risk limits the upside.

USD/CAD and USD/MXN Q4 2026 Outlook: Will the U.S. Dollar Dominate North America Again?
The final stretch of 2026 is approaching, and North America's major currencies have begun to show a shift in the strength dynamics seen earlier in the year. New expectations of a more aggressive monetary policy stance, particularly in the United States, could be significantly reshaping the outlook for the region. At the same time, this backdrop, combined with potential trade tensions across North America, may become one of the most important drivers of currency performance in the months ahead.

StoneX Europe Ltd may make third party material available on this website which may contain information included but not limited to the conditions of financial markets. The material is for information purposes only and does not contain, and should not be construed as containing, investment advice and/or investment recommendation and/or an investment research and/or an offer of or solicitation for any transactions in financial instruments; any decision to enter into a specific transaction shall be made by the client following an assessment by him/her of their situation.
StoneX Europe Ltd makes no representation or warranty and assumes no liability as to the accuracy or completeness of the information provided, nor any loss arising from any investment based on a recommendation, forecast or other information supplied. You should always seek independent advice as to your suitability to speculate in any related markets and your ability to assume the associated risks, if you are at all unsure. We are not under any obligation to update any such material. Any opinion made may be personal to the author and may not reflect the opinion of StoneX Europe Ltd.