



China A50 Index and Hang Seng Index Regain Upward Momentum
Both the China A50 Index and Hang Seng Index rose around 7% from May's low. In addition, both indexes broke above the declining trend line drawn from the January top.......
Share this:
Both the China A50 Index and Hang Seng Index rose around 7% from May's low. In addition, both indexes broke above the declining trend line drawn from the January top. It would suggest that the both indexes have made a significant bottom in March.
China's Caixin Services PMI rose to 55.0 in May (47.3 expected) from 44.4 in April. Key findings included:" Business activity and new work rise at quickest rates since late 2010 (...) Pandemic continues to weigh heavily on export orders (...) Employment falls slightly as firms look to raise efficiency."
In the below chart, the Caixin Services PMI rose the fourth month after reaching the bottom since March. It suggests that the non-manufacturing activities regain the upward momentum after the outbreak of COVID-19.

Sources: Trading Economic
Next week, investors should focus on the imports (-9.7% expected) and exports (-7.0% expected) data.
In addition, different countries in the world have started to launch stimulus packages, when the situation of COVID-19 eased. Moreover, the interest rate in those developed countries are at relatively low levels. When the investors' risk appetite increased, investors would increase the investment of higher risk assets, such as the equities index and stocks.
Let's take a look at the daily chart of the China A50 Index.
Source: GAIN Capital, TradingView
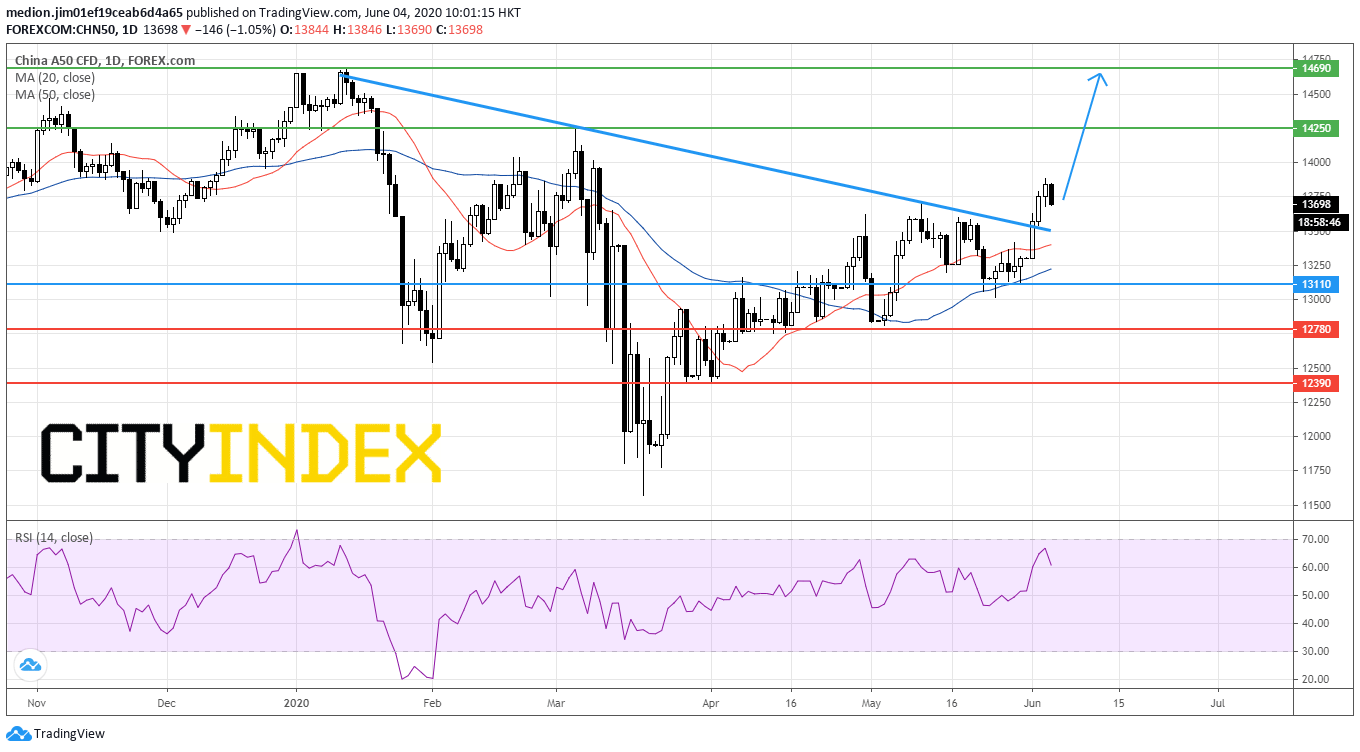
From a technical point of view, China A50 Index has recorded a series of higher tops and higher bottoms since March. Currently, the prices are trading above both rising 20-day and 50-day moving averages.
The RSI also reached a new high around the 60s, suggesting the upside momentum for the prices.
The readers could set the support level at 13110 (the low of May 29), while resistance levels would be located at 14250 (the high of February) and 14690 (the high of January).
After that, we will check out the daily chart of Hang Seng Index
Source: GAIN Capital, TradingView
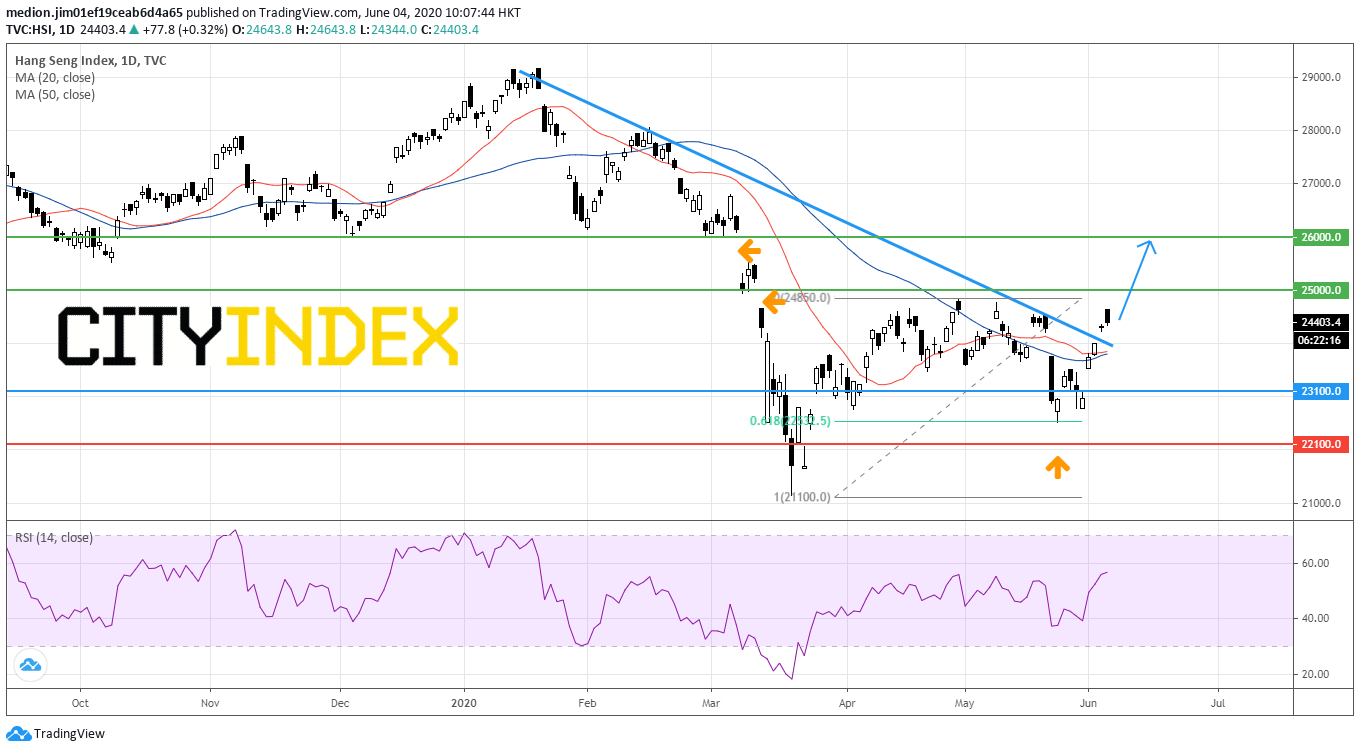
The RSI has marked a new high and is still heading upward , suggesting the upward momentum for the prices.
Bullish readers could set the support level at 23100 (the gap created on May 29), while the resistance levels would be 25000 (a gap occurred on March 12) and 26000 (a gap occurred on March 9).
China's Caixin Services PMI rose to 55.0 in May (47.3 expected) from 44.4 in April. Key findings included:" Business activity and new work rise at quickest rates since late 2010 (...) Pandemic continues to weigh heavily on export orders (...) Employment falls slightly as firms look to raise efficiency."
In the below chart, the Caixin Services PMI rose the fourth month after reaching the bottom since March. It suggests that the non-manufacturing activities regain the upward momentum after the outbreak of COVID-19.
Sources: Trading Economic
Next week, investors should focus on the imports (-9.7% expected) and exports (-7.0% expected) data.
In addition, different countries in the world have started to launch stimulus packages, when the situation of COVID-19 eased. Moreover, the interest rate in those developed countries are at relatively low levels. When the investors' risk appetite increased, investors would increase the investment of higher risk assets, such as the equities index and stocks.
Let's take a look at the daily chart of the China A50 Index.
Source: GAIN Capital, TradingView
From a technical point of view, China A50 Index has recorded a series of higher tops and higher bottoms since March. Currently, the prices are trading above both rising 20-day and 50-day moving averages.
The RSI also reached a new high around the 60s, suggesting the upside momentum for the prices.
The readers could set the support level at 13110 (the low of May 29), while resistance levels would be located at 14250 (the high of February) and 14690 (the high of January).
After that, we will check out the daily chart of Hang Seng Index
Source: GAIN Capital, TradingView
The Hang Seng Index posted a rebound after forming a reversal bar at 22600 (Fibonacci 61.8% retracement level between the bottom of March and the high of April). Currently, the index prices returned the level above the level of 20-day and 50-day moving averages. Besides, the 50-day moving average is reversing up, indicating that the trend in a longer period is turning to positive.
The RSI has marked a new high and is still heading upward , suggesting the upward momentum for the prices.
Bullish readers could set the support level at 23100 (the gap created on May 29), while the resistance levels would be 25000 (a gap occurred on March 12) and 26000 (a gap occurred on March 9).
Both the China A50 Index and Hang Seng Index rose around 7% from May's low. In addition, both indexes broke above the declining trend line drawn from the January top. It would suggest that the both indexes have made a significant bottom in March.
China's Caixin Services PMI rose to 55.0 in May (47.3 expected) from 44.4 in April. Key findings included:" Business activity and new work rise at quickest rates since late 2010 (...) Pandemic continues to weigh heavily on export orders (...) Employment falls slightly as firms look to raise efficiency."
In the below chart, the Caixin Services PMI rose the fourth month after reaching the bottom since March. It suggests that the non-manufacturing activities regain the upward momentum after the outbreak of COVID-19.

Sources: Trading Economic
Next week, investors should focus on the imports (-9.7% expected) and exports (-7.0% expected) data.
In addition, different countries in the world have started to launch stimulus packages, when the situation of COVID-19 eased. Moreover, the interest rate in those developed countries are at relatively low levels. When the investors' risk appetite increased, investors would increase the investment of higher risk assets, such as the equities index and stocks.
Let's take a look at the daily chart of the China A50 Index.
Source: GAIN Capital, TradingView
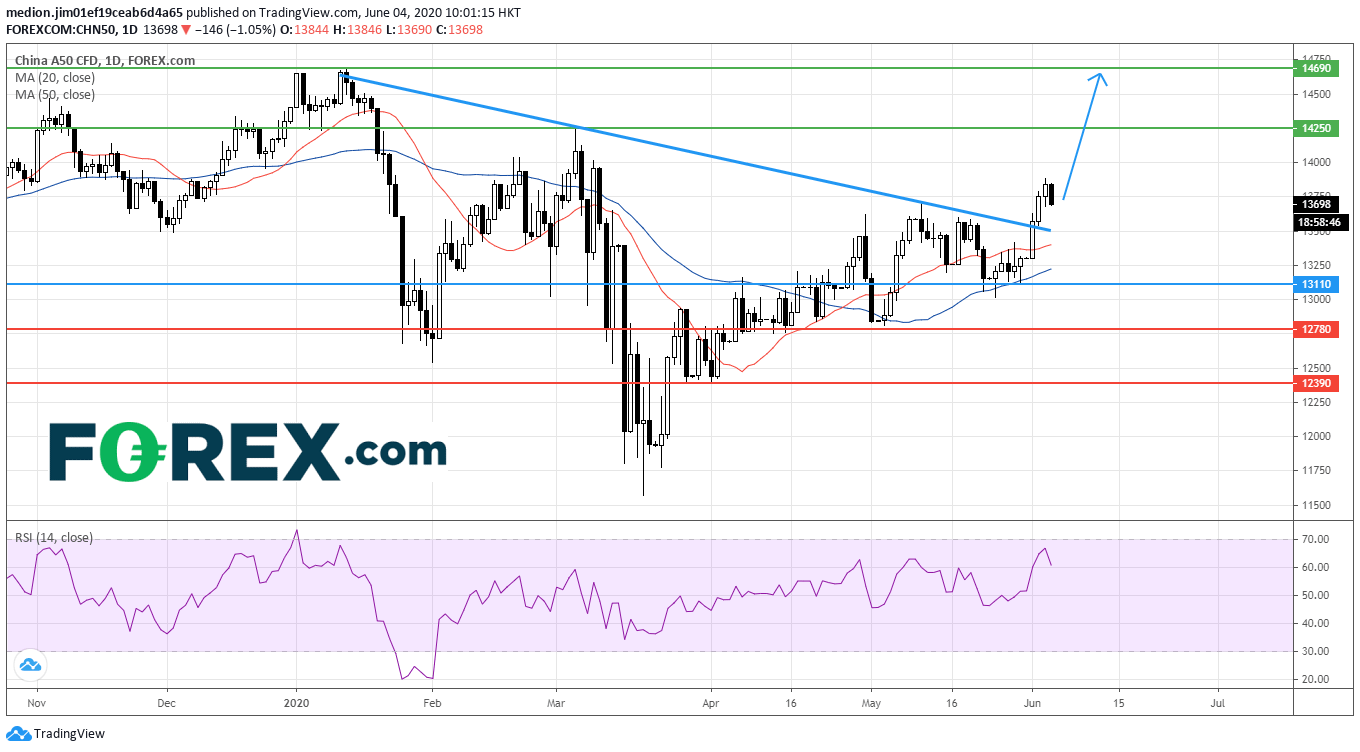
From a technical point of view, China A50 Index has recorded a series of higher tops and higher bottoms since March. Currently, the prices are trading above both rising 20-day and 50-day moving averages.
The RSI also reached a new high around the 60s, suggesting the upside momentum for the prices.
The readers could set the support level at 13110 (the low of May 29), while resistance levels would be located at 14250 (the high of February) and 14690 (the high of January).
After that, we will check out the daily chart of Hang Seng Index
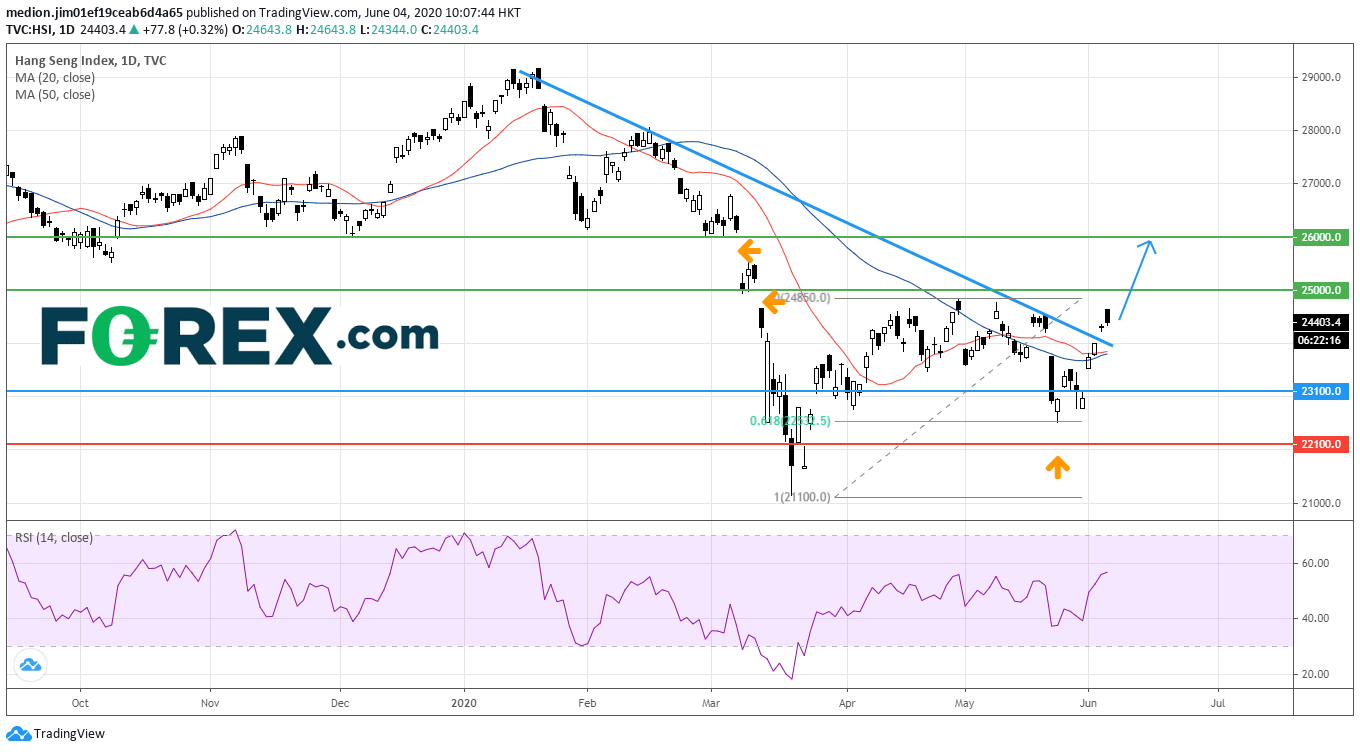
Source: GAIN Capital, TradingView
The RSI has marked a new high and is still heading upward , suggesting the upward momentum for the prices.
Bullish readers could set the support level at 23100 (the gap created on May 29), while the resistance levels would be 25000 (a gap occurred on March 12) and 26000 (a gap occurred on March 9).
China's Caixin Services PMI rose to 55.0 in May (47.3 expected) from 44.4 in April. Key findings included:" Business activity and new work rise at quickest rates since late 2010 (...) Pandemic continues to weigh heavily on export orders (...) Employment falls slightly as firms look to raise efficiency."
In the below chart, the Caixin Services PMI rose the fourth month after reaching the bottom since March. It suggests that the non-manufacturing activities regain the upward momentum after the outbreak of COVID-19.
Sources: Trading Economic
Next week, investors should focus on the imports (-9.7% expected) and exports (-7.0% expected) data.
In addition, different countries in the world have started to launch stimulus packages, when the situation of COVID-19 eased. Moreover, the interest rate in those developed countries are at relatively low levels. When the investors' risk appetite increased, investors would increase the investment of higher risk assets, such as the equities index and stocks.
Let's take a look at the daily chart of the China A50 Index.
Source: GAIN Capital, TradingView
From a technical point of view, China A50 Index has recorded a series of higher tops and higher bottoms since March. Currently, the prices are trading above both rising 20-day and 50-day moving averages.
The RSI also reached a new high around the 60s, suggesting the upside momentum for the prices.
The readers could set the support level at 13110 (the low of May 29), while resistance levels would be located at 14250 (the high of February) and 14690 (the high of January).
After that, we will check out the daily chart of Hang Seng Index
Source: GAIN Capital, TradingView
The Hang Seng Index posted a rebound after forming a reversal bar at 22600 (Fibonacci 61.8% retracement level between the bottom of March and the high of April). Currently, the index prices returned the level above the level of 20-day and 50-day moving averages. Besides, the 50-day moving average is reversing up, indicating that the trend in a longer period is turning to positive.
The RSI has marked a new high and is still heading upward , suggesting the upward momentum for the prices.
Bullish readers could set the support level at 23100 (the gap created on May 29), while the resistance levels would be 25000 (a gap occurred on March 12) and 26000 (a gap occurred on March 9).




The complete CFD trading experience
Award-winning platforms, competitive spreads, low commissions and dedicated support.
We live and breathe the markets and are dedicated to helping traders realise their ambitions as we continue to set the industry bar.
Economic calendar
Web Trader platform
Our sophisticated web-based platform is packed with features.
Related articles

Dow Jones Slide Shows What Rate Hike Bets Mean for Stocks
The Dow Jones support breakdown shows rising bond yields and rate hike bets hitting U.S. stocks while tech giants prop up the Nasdaq.


Dow Jones forecast: Stock markets under pressure from multiple sources
When looking at the major tech-heavy US indices like the S&P 500 or the Nasdaq 100, you wouldn’t think that the stock market is particularly weak. Yet, beneath the surface, the market is far from healthy right now. Investors are evidently just piling into the big tech and AI names, and as a result, market breadth is deteriorating. Other indices like the small cap Russell 2000 and the Dow Jones are starting to reflect that weakness.

Nikkei breakout accelerates as yen weakness returns
Nikkei has started October with a powerful breakout, helped by renewed yen weakness and strong upside momentum

StoneX Europe Ltd may make third party material available on this website which may contain information included but not limited to the conditions of financial markets. The material is for information purposes only and does not contain, and should not be construed as containing, investment advice and/or investment recommendation and/or an investment research and/or an offer of or solicitation for any transactions in financial instruments; any decision to enter into a specific transaction shall be made by the client following an assessment by him/her of their situation.
StoneX Europe Ltd makes no representation or warranty and assumes no liability as to the accuracy or completeness of the information provided, nor any loss arising from any investment based on a recommendation, forecast or other information supplied. You should always seek independent advice as to your suitability to speculate in any related markets and your ability to assume the associated risks, if you are at all unsure. We are not under any obligation to update any such material. Any opinion made may be personal to the author and may not reflect the opinion of StoneX Europe Ltd.