






Crude oil, iron ore showing signs of life ahead of China data dump
If you purely focus on the fundamentals of crude oil and iron ore, you’d be rightly feeling bearish. However, fundamentals and direction don’t always agree in these increasingly financialised markets, meaning you should arguably put just as much emphasis on price action to guide your investment decisions.
Share this:

- Financialisation of crude oil and iron ore means you need to pay attention to price action as much as fundamentals
- Having fallen to YTD lows, both markets look like they may have bottomed in the near-term
- China industrial production, property construction data released this weekend
Overview
If you purely focus on the fundamentals of crude oil and iron ore, you’d be rightly feeling bearish. Both look oversupplied relative to demand in the near-term, with the added threat of a more pronounced global economic slowdown. However, fundamentals and direction don’t always agree in these increasingly financialised markets, meaning you should arguably put just as much emphasis on price action to guide your investment decisions.
WTI crude oil long setup
WTI crude oil has behaved exactly as you’d expect after slicing through long-running uptrend support on big volumes, dribbling lower after a failed back-test of the level. Rallies were sold into, as demonstrated by the long topside wicks of some of the daily candles, eventually finding a floor at $65.26.
While undeniably bearish, the price action has been more constructive recently. After being bought off the lows on Tuesday below $66, the same price action was seen on Wednesday, likely contributing to the bullish candle that printed Thursday.
One look at the daily tells you there’s decent two-way flow around $69, as demonstrated by the price action around the level over the past two weeks. Now that it has cleared the level, it increases the probability we may see an extension higher.
Those considering taking on the long trade could buy around these levels with a stop below $69 for protection. Targets include $71.50 and former uptrend located just above. If the price were to break back above the latter, $73.52 would be the next logical target.
If the price were to break to reverse back below the $69, the near-term bullish bias would be negated.
Momentum is starting to show signs of turning bullish, with RSI (14) looking like it may break the downtrend it’s been in since late August. MACD has yet to confirm, although it looks like it’s starting to flick higher towards the signal line.
SGX iron ore setups around $95.40
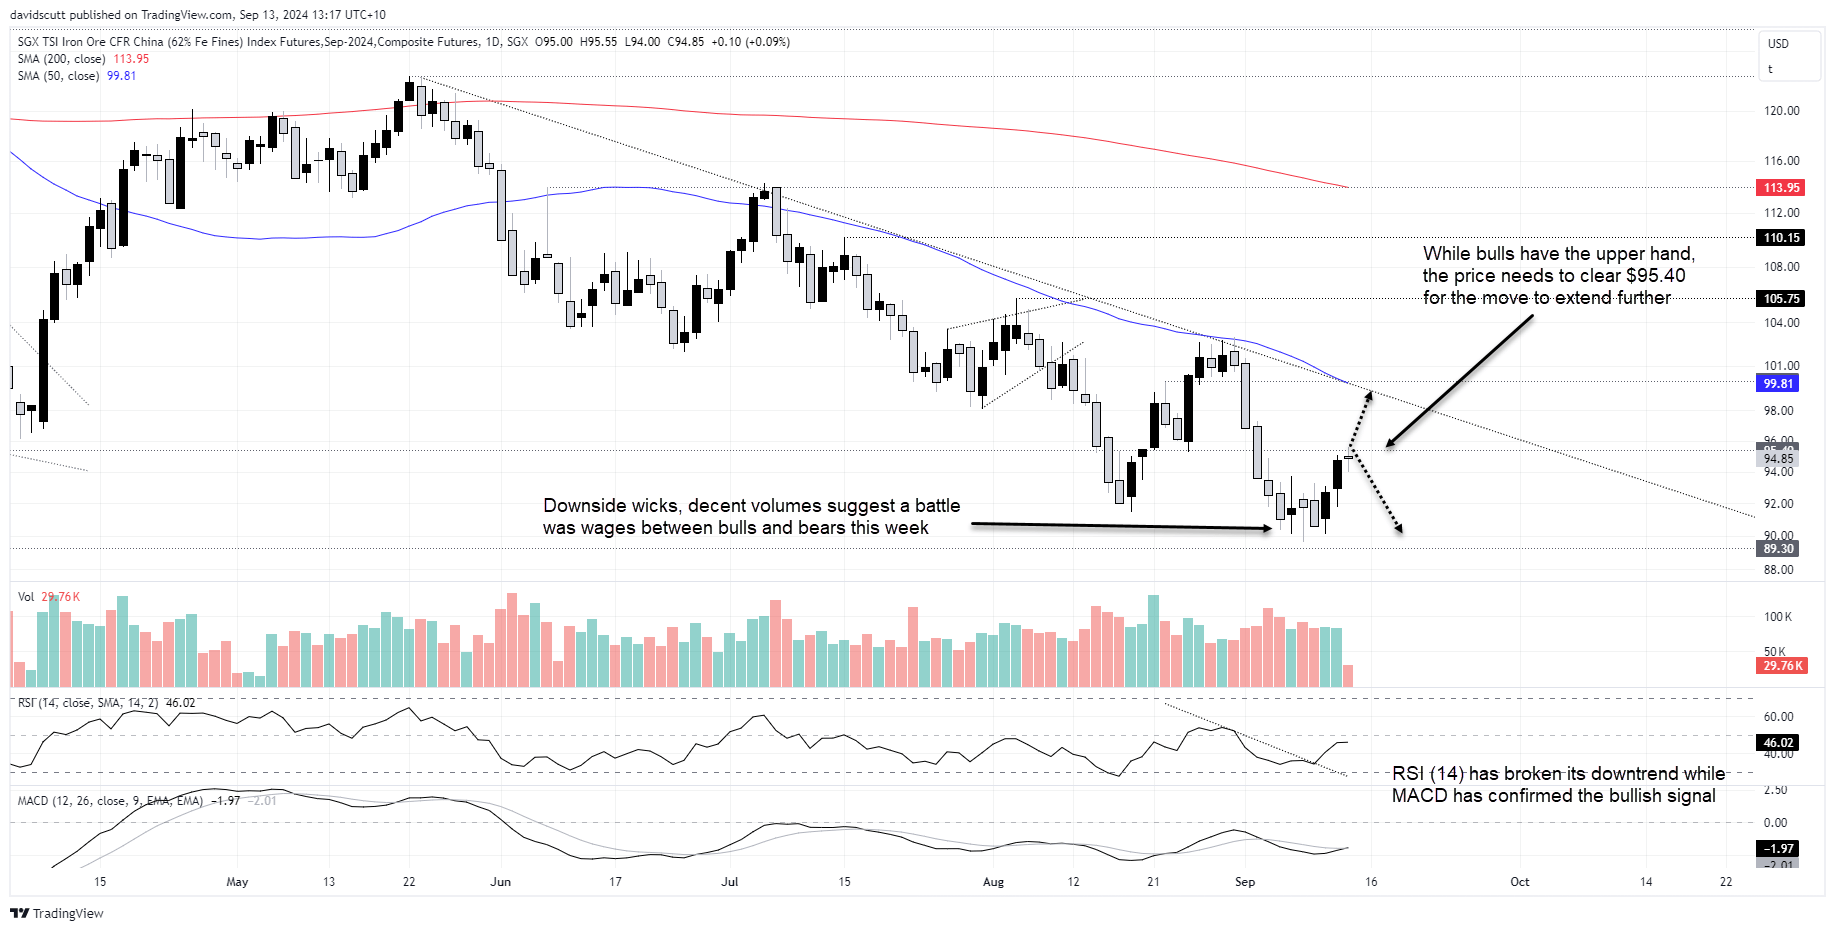
SGX iron ore sits in a similar position to crude with the price in a clear downtrend but some evidence it may have bottomed. The downside wicks on the daily candles below $91, accompanied by decent volumes, suggests a battle between bulls and bears was waged over the past week, with the recent price action pointing to bulls gaining the upper hand.
RSI (14) has broken its downtrend with MACD confirming the bullish signal, pointing to a shift bearish momentum. Given that and recent price action, traders should be on alert for a potential break above resistance at $95.40. If it were to go, longs could be established above the figure with tight stop below. The initial target would be around $99, the current location of the 50-day moving average and downtrend dating back to May. If that level were to break, it could lead to a far greater extension of the rebound.
If $95.40 were to hold firm the trade could be flipped, with shorts established beneath the level with a tight stop above. $90 would be one target with longer-running support at $89.30 the next after that.
Chinese industrial production and fixed asset investment data for August will be released on Saturday, including information on steel production and property construction. With pessimism elevated, it would have to take a terrible outcome to deliver a true downside surprise. It also leaves room for upside if the data suggests extreme pessimism is not warranted.
-- Written by David Scutt
Follow David on Twitter @scutty
How to trade with City Index
You can trade with City Index by following these four easy steps:
- Open an account, or log in if you’re already a customer
• Open an account in the UK
• Open an account in Australia
• Open an account in Singapore
- Search for the market you want to trade in our award-winning platform
- Choose your position and size, and your stop and limit levels
- Place the trade
Related tags:
Latest market news




The complete CFD trading experience
Award-winning platforms, competitive spreads, low commissions and dedicated support.
We live and breathe the markets and are dedicated to helping traders realise their ambitions as we continue to set the industry bar.
Economic calendar
Web Trader platform
Our sophisticated web-based platform is packed with features.
Related articles
Nasdaq 100 Forecast: NDX rebounds as oil prices fall and ahead of Apple earnings
U.S. stock indices are moving higher on Monday as tech and AI-related stocks steady following a shocking October. The mood remains cautious following the AI wobble, with more tech earnings due this week, U.S. midterm elections and a full U.S. economic data calendar.

Gold forecast: XAU/USD stabilised after recent falls – for now
Gold has started the first week of the new month trying to recover some ground after another bruising week. Oil prices have taken a sharp drop and that has allowed risk assets to bounce back, which has clearly helped the precious metal too. However, with sentiment remaining bearish towards the metals, and with $4000 level having been taken out last week, the path of least resistance is to the downside for gold.

GBP/USD outlook: Currency Pair of the Week | November 2, 2026
The GBP/USD heads into a crowded week of event risk, with the midterm elections, a Bank of England rate decision and Friday's non-farm payrolls report all capable of moving markets sharply. The greenback remains fundamentally well supported by a hawkish Federal Reserve, but much of that is already priced in, while the renewed sell-off in technology stocks has exposed its vulnerability.
StoneX Europe Ltd may make third party material available on this website which may contain information included but not limited to the conditions of financial markets. The material is for information purposes only and does not contain, and should not be construed as containing, investment advice and/or investment recommendation and/or an investment research and/or an offer of or solicitation for any transactions in financial instruments; any decision to enter into a specific transaction shall be made by the client following an assessment by him/her of their situation.
StoneX Europe Ltd makes no representation or warranty and assumes no liability as to the accuracy or completeness of the information provided, nor any loss arising from any investment based on a recommendation, forecast or other information supplied. You should always seek independent advice as to your suitability to speculate in any related markets and your ability to assume the associated risks, if you are at all unsure. We are not under any obligation to update any such material. Any opinion made may be personal to the author and may not reflect the opinion of StoneX Europe Ltd.