



Crude Oil, Nasdaq Price Outlook: Risks of Another Market Drawdown Build
Crude Oil, Nasdaq Price Outlook: Risks of another market drawdown are building as tensions intensify over ceasefire negotiations between the US and Iran. Despite Trump’s positive comments, risks remain, and key levels are in focus to confirm structural shifts on the charts.
Share this:

Risks for another market drawdown continue to build as tensions escalate around ceasefire developments between the US and Iran. Despite Trump’s optimistic remarks, risks persist, and key levels remain critical to confirm structural shifts across both crude oil and the Nasdaq.
Crude’s stickiness near the $90–$100 range is sustaining inflation risks, pressuring yields, and reinforcing hawkish central bank expectations. In turn, this continues to promote bearish scenarios across risk assets and precious metals.
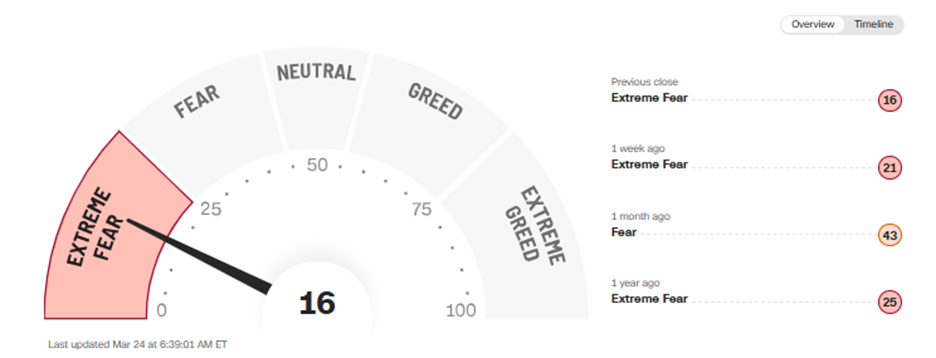
CNN Fear and Greed Index
Source: CNN
The index dropped to 10 yesterday, marking extreme fear levels last seen in April 2025 amid reciprocal tariff rhetoric, keeping bearish scenarios intact.
Trump’s comments regarding positive negotiations with Iran, including a potential postponement of strikes on key power plants, briefly lifted market sentiment. However, this move was quickly reversed following Iran’s denial of such developments.
As a result, sentiment remains firmly in bearish territory, with the index only recovering marginally from 10 to 16. Key levels remain in focus to confirm any meaningful structural shifts, whether for dip-buying opportunities or trend-following setups.
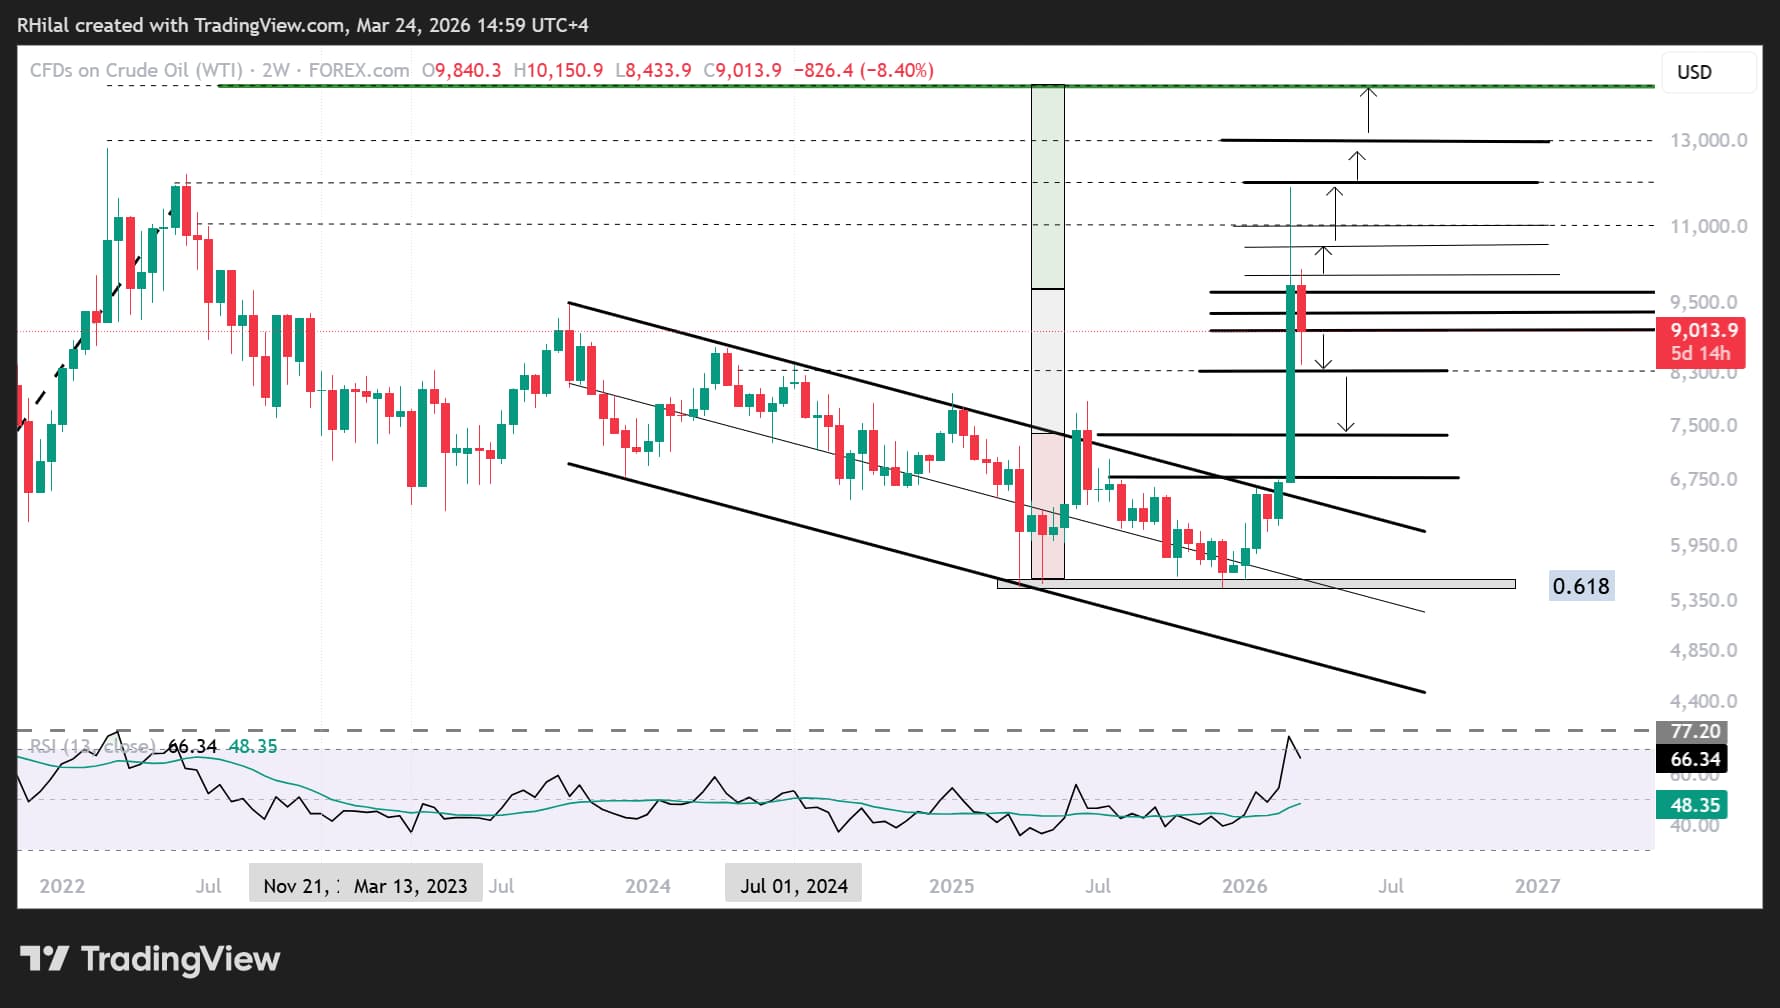
Crude Oil: 2-Week Time Frame – Log Scale
Source: Trading view
Three scenarios can be outlined on the crude oil chart, in line with the Strait of Hormuz dynamics discussed in my previous article: Crude Oil Price Outlook: Strait of Hormuz Scenario Analysis
Bullish Scenario:
A close above the $100 mark increases upside risks toward $110 and $120, where either a pullback may emerge or a breakout could extend toward $130 and $150, respectively. This scenario would likely align with further disruptions in oil supply routes and infrastructure.
Neutral/Bullish Scenario (Base Case):
WTI fluctuating within the $80–$100 range keeps inflationary and upside risks intact. However, a decisive close below $88 and $80 would shift momentum, potentially driving prices back toward the 2025 Middle East tension highs at $75–$73.
Bearish Scenario:
A break below the $75 level would extend bearish forecasts. This scenario would likely coincide with de-escalation in Middle East tensions and the gradual normalization of transit flows through the Strait of Hormuz. Such a move could support prices within the $64–$67 range, with further downside consolidation toward the lower $60s, aligning with the Trump administration’s broader policy agenda.
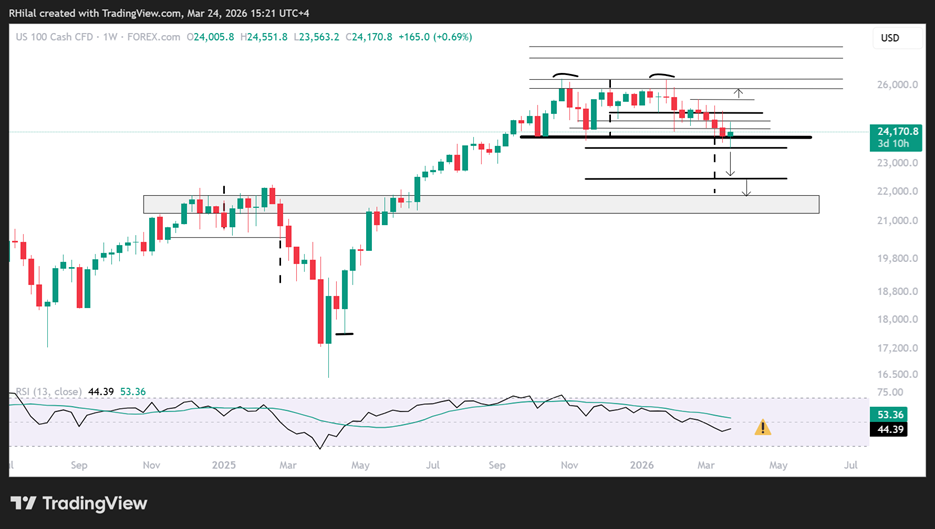
Nasdaq: 1-Week Time Frame – Log Scale
Source: Trading view
In line with the double top pattern formed between the December 2024 and February 2025 highs, which preceded a sharp downturn and dip-buying opportunity in April 2025, similar risks are now emerging for April 2026.
The Nasdaq continues to consolidate below the October 2025 and January 2026 highs, forming a potential double top below the 26,300 level, while currently testing the 23,500 neckline.
Bearish Scenario:
A close below 23,500, combined with a weekly RSI trending below the neutral 50 level, would confirm the double top pattern and extend drawdown risks toward 22,400 and 22,200—levels aligned with the previous structure and potential dip-buying zones.
Bullish Scenario:
The index needs to reclaim 24,600 and 24,900 to restore bullish momentum toward 25,500 and 25,800. A break above these levels would open the path back toward 26,300 and the 27,000 zone, signaling a continuation of the long-term uptrend.
Written by Razan Hilal, CMT
Follow on X: @Rh_waves




The complete CFD trading experience
Award-winning platforms, competitive spreads, low commissions and dedicated support.
We live and breathe the markets and are dedicated to helping traders realise their ambitions as we continue to set the industry bar.
Economic calendar
Web Trader platform
Our sophisticated web-based platform is packed with features.
Related articles

Nasdaq Breakout Potential into Q4 for Melt Up Scenarios
The headlines seem negative in almost any place that you look, with surging Treasury yields and frothy AI valuations getting more and more attention. But, if it’s so bad, why hasn’t the Nasdaq melted down yet, even as the Fed has started hiking rates?


S&P 500 Forecast: SPX rises after cooler-than-expected inflation data
U.S. stocks are rising and Treasury yields are falling after data showed that inflation increased at a cooler pace than expected, while U.S. consumer spending rose again in August.


EUR/USD forecast: Eurozone stagflation risks mount as dollar holds firm ahead of data
The dollar was bouncing back at the time of writing, after it had eased overnight on the back of some weaker-than-expected economic data yesterday which had prompted markets to scale back expectations of an October Fed rate hike. However, with more significant US data due today and Friday, and with oil prices continuing to remain elevated, the dollar’s broader direction remains bullish.

StoneX Europe Ltd may make third party material available on this website which may contain information included but not limited to the conditions of financial markets. The material is for information purposes only and does not contain, and should not be construed as containing, investment advice and/or investment recommendation and/or an investment research and/or an offer of or solicitation for any transactions in financial instruments; any decision to enter into a specific transaction shall be made by the client following an assessment by him/her of their situation.
StoneX Europe Ltd makes no representation or warranty and assumes no liability as to the accuracy or completeness of the information provided, nor any loss arising from any investment based on a recommendation, forecast or other information supplied. You should always seek independent advice as to your suitability to speculate in any related markets and your ability to assume the associated risks, if you are at all unsure. We are not under any obligation to update any such material. Any opinion made may be personal to the author and may not reflect the opinion of StoneX Europe Ltd.