



Crude Oil Rally Running Low on Gas?
WTI crude oil holds above $100, but bearish price action near resistance suggests the powerful rally may be losing momentum.
Share this:

Crude oil’s break above $100 has been driven by escalating Middle East supply risks, including disruptions through the Strait of Hormuz, attacks on tankers and Saudi energy infrastructure, and reduced OPEC output.
View related analysis:
- USD/JPY Grinds Higher ahead of FOMC, AUD/JPY Clings to Support
- Yen Bears Finally Flip, Can US Dollar Bulls Regain Ground? | COT Report
- GBP/USD Rebounds on GDP, but US CPI Could Decide the Next Move
- Dow Leads Wall Street Lower on Inflation Fears, Nasdaq Defies Weak Breadth
- Australian Dollar Outlook: AUD/USD Rally Stalls as Fed Risk Returns
WTI Crude Oil Rally Stalls as Momentum Fades
The rally has since lost momentum as much of the immediate risk has been priced in and markets adapt to prolonged disruption. Physical markets remain tight, so another supply shock could quickly revive the rally. But without fresh escalation, the failure to extend above resistance suggests the near-term risk/reward is becoming less favourable for oil bulls.
Still, that does not make this a slam-dunk short for bears. Geopolitics sent prices this high and could just as easily send them above 108 if things escalate once more. But recent price action should at least serve as a warning to bulls considering chasing this move.
WTI Rally Stalls Beneath Resistance as Momentum Fades
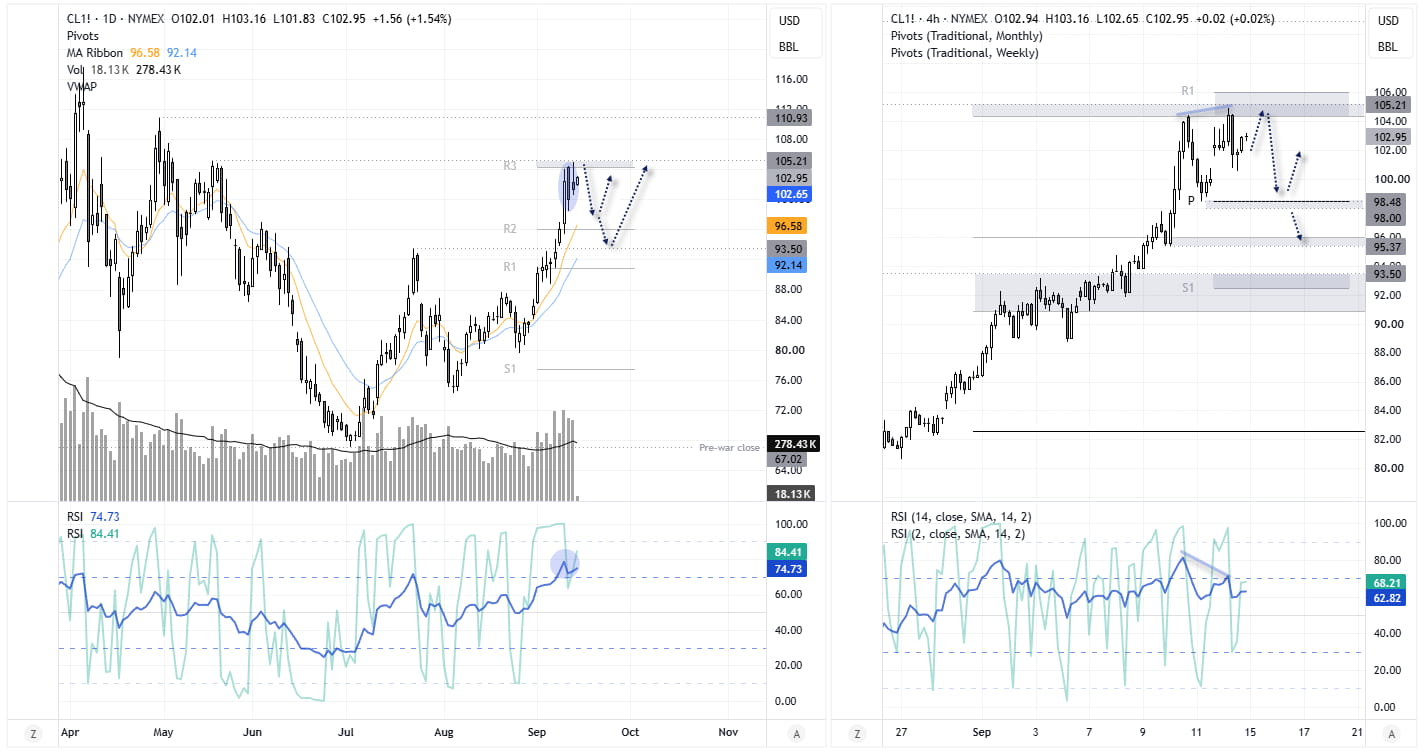
The daily chart (left) shows a strong rally into Thursday’s high, before bearish volatility kicked in beneath the 105.21 high and monthly R3 pivot. The fact that prices reached R3 before the halfway point of the month is a cause for concern for bulls, as it suggests an overextended market. The shooting star candle and overbought RSIs also add to that case.
Source: NYMEX, TradingView
WTI Bears Eye a Counter-Trend Move Below 104
The 4-hour chart (right) shows a bearish engulfing candle formed before prices fell closer towards 100. Prices are drifting higher, so perhaps bulls will have another crack at the highs. But unless a fresh bullish catalyst arrives, I remain suspicious of oil’s ability to break immediately higher. Bears could therefore seek evidence of a false break or lower high below 104 as part of a near-term counter-trend move.
Bearish targets could include 100, the 98.48 swing low and the weekly pivot point near 98. Also note the monthly R2 pivot near the 96 handle and 10-day EMA. These support levels could also tempt bulls back to the table.
Crude Oil Positioning Remains Supportive Despite Rising Shorts
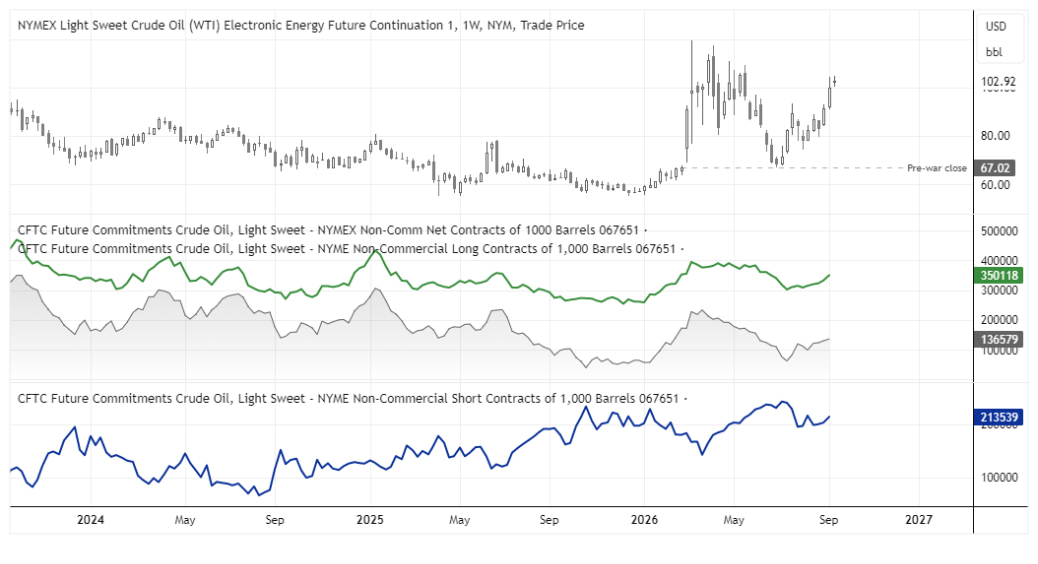
It is also worth remembering that net-long exposure has been tracking prices higher, with longs being added and shorts falling in recent weeks. That said, there was a slight uptick in shorts among large speculators last week. But this chart still shows that higher-timeframe support remains in place, and we are unlikely to see a sharp selloff without a drastic change in geopolitical circumstances.
Source: COT (CFTC), LSEG
Related tags:
Latest market news




The complete CFD trading experience
Award-winning platforms, competitive spreads, low commissions and dedicated support.
We live and breathe the markets and are dedicated to helping traders realise their ambitions as we continue to set the industry bar.
Economic calendar
Web Trader platform
Our sophisticated web-based platform is packed with features.
Related articles
Silver's bullish breakout case builds as bond yields retreat
The Democratic blue wave has sent crude and Treasury yields sharply lower, improving the outlook for precious metals. With gold already breaking higher, could silver be next?
Swiss Franc Short-term Outlook: USD/CHF Selloff Nears Critical Support Ahead of NFP 11 4 2026
USD/CHF bears are closing in on critical trend support, with the next reaction likely to determine whether the October decline has further to run.


Euro Technical Outlook: EUR/USD Support Reversal Sets Up Breakout Test Ahead of NFP 11 4 2026
Euro bulls are attempting to build on the rebound from recent lows, but pivotal resistance still stands in the way of a larger EUR/USD recovery.
StoneX Europe Ltd may make third party material available on this website which may contain information included but not limited to the conditions of financial markets. The material is for information purposes only and does not contain, and should not be construed as containing, investment advice and/or investment recommendation and/or an investment research and/or an offer of or solicitation for any transactions in financial instruments; any decision to enter into a specific transaction shall be made by the client following an assessment by him/her of their situation.
StoneX Europe Ltd makes no representation or warranty and assumes no liability as to the accuracy or completeness of the information provided, nor any loss arising from any investment based on a recommendation, forecast or other information supplied. You should always seek independent advice as to your suitability to speculate in any related markets and your ability to assume the associated risks, if you are at all unsure. We are not under any obligation to update any such material. Any opinion made may be personal to the author and may not reflect the opinion of StoneX Europe Ltd.