





Currency Pair of the Week GBPUSD
With the reopening of the UK underway and the reopening of the US in full swing, the British Pound may outperform the US Dollar.
Share this:

The UK will release jobs data for March this week. The Claimant Count Change is expected to have risen by 150,000 vs 86,600 in February. If this month’s print is above February's, it will be the most since May 2020. Also, the unemployment rate is expected to uptick to 5.1% from 5%, and average hourly earnings is expected to remain unchanged at 4.2%. However, traders may be looking past this data as the country was still in a lockdown for most of March. It was not until April that the reopening began in earnest, as pubs, gyms, hairstylists and other service sector merchants began to open. With the recovery under way, GBP may outperform many of its peers. Jobs and spending should begin to increase, particularly in the service sector. The vaccine rollout continues to be strong, despite the AstraZeneca hiccup, with 32 million people receiving at least the first jab. The BOE doesn’t meet again until May 6th, however with the resignation of chief economist Haldane, the biggest hawk of the group, don’t expect much. They may also require more time to see how the recovery unfolds.
The US data has exploded in recent weeks, with March employment data, retail sales, and manufacturing data all strong and better than expected. This trend is likely to continue as the US reopening continues into the summer months. Travel and leisure, as well as restaurants, will be re-hiring and employment and spending should continue to rise. Similar to the UK, the vaccine rollout has been strong despite the hiccup with the Johnson and Johnson vaccine. 25% of the total US population has been fully vaccinated. In some states, neither restrictions nor masks are required. However, despite all the good news, the US Federal Reserve insists that they will remain with current monetary policy until ACTUAL inflation is sustained within their 2%-3% target. They feel inflation expectations are transitory and the rise in bond yields is unsustainable. This is good news for stocks and bad news for the US Dollar. With the stimulus plan approval behind us, Joe Biden is now working on a infrastructure program worth $2 trillion, however the debate in Congress is expected to last months.
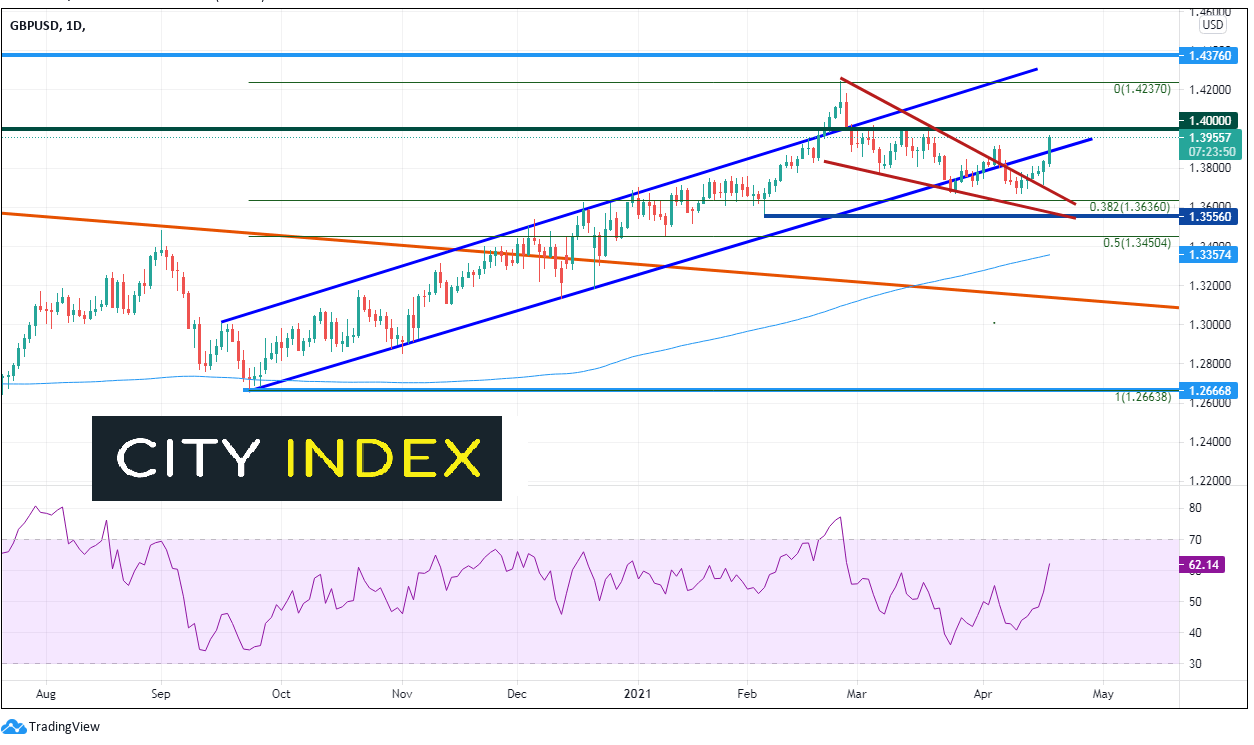
GBP/USD has been in a channel uptrend since early September 2020. The pair briefly broke above the top of the channel on February 19th, only to put in a shooting star candlestick on February 24th at 1.4376. The pair then pulled back into the channel. As we often see, a false breakout on one side of the channel often leads to a test of the opposite trendline. GBP/USD formed a descending wedge off the highs and moved below the bottom, upward sloping channel of the trendline. The pair held the 38.2% Fibonacci retracement level from the September 23rd, 2020 lows to the February 24th highs, near 1.3630. Last week, GBP/USD broke above the descending wedge and has since moved higher back into the channel. The target for the breakout of a descending wedge is a 100% retracement, which is the recent highs at 1.4237.
Source: Tradingview, City Index
On a 240-minute timeframe, as of the time of this writing, GBP/USD is at resistance at the 50% retracement level from the February 23rd highs to the April 12th lows near 1.3956. The psychological round number 1.4000 level acts as the level of resistance above, and then the 61.8% Fibonacci retracement level from the same time period at 1.4025. First support is at Monday’s lows near 1.3810. The next level of support is the top, downward channel of the wedge near 1.3680, and then the recent lows near 1.3665. Notice that the RSI has moved into overbought territory above 70, which indicates that the pair may be ready for a near-term pullback.
Source: Tradingview, City Index
With the reopening of the UK underway and the reopening of the US in full swing, the British Pound may outperform the US Dollar. In addition, the pullback on the daily chart to the 38.2% longer-term Fibonacci retracement level indicates a weak pullback and that the bulls are in control. A break below the 50% level near 1.3450 would indicate the pair is in trouble.
Learn more about forex trading opportunities.
The UK will release jobs data for March this week. The Claimant Count Change is expected to have risen by 150,000 vs 86,600 in February. If this month’s print is above February's, it will be the most since May 2020. Also, the unemployment rate is expected to uptick to 5.1% from 5%, and average hourly earnings is expected to remain unchanged at 4.2%. However, traders may be looking past this data as the country was still in a lockdown for most of March. It was not until April that the reopening began in earnest, as pubs, gyms, hairstylists and other service sector merchants began to open. With the recovery under way, GBP may outperform many of its peers. Jobs and spending should begin to increase, particularly in the service sector. The vaccine rollout continues to be strong, despite the AstraZeneca hiccup, with 32 million people receiving at least the first jab. The BOE doesn’t meet again until May 6th, however with the resignation of chief economist Haldane, the biggest hawk of the group, don’t expect much. They may also require more time to see how the recovery unfolds.
The US data has exploded in recent weeks, with March employment data, retail sales, and manufacturing data all strong and better than expected. This trend is likely to continue as the US reopening continues into the summer months. Travel and leisure, as well as restaurants, will be re-hiring and employment and spending should continue to rise. Similar to the UK, the vaccine rollout has been strong despite the hiccup with the Johnson and Johnson vaccine. 25% of the total US population has been fully vaccinated. In some states, neither restrictions nor masks are required. However, despite all the good news, the US Federal Reserve insists that they will remain with current monetary policy until ACTUAL inflation is sustained within their 2%-3% target. They feel inflation expectations are transitory and the rise in bond yields is unsustainable. This is good news for stocks and bad news for the US Dollar. With the stimulus plan approval behind us, Joe Biden is now working on a infrastructure program worth $2 trillion, however the debate in Congress is expected to last months.
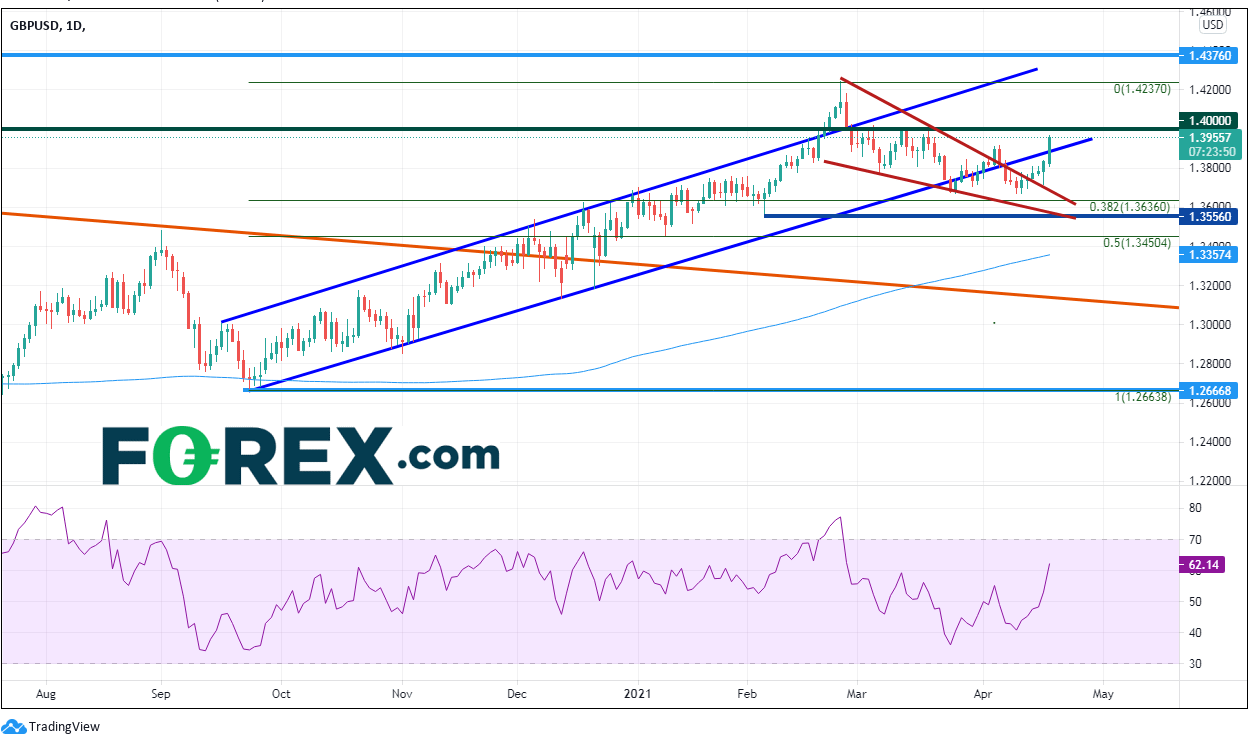
GBP/USD has been in a channel uptrend since early September 2020. The pair briefly broke above the top of the channel on February 19th, only to put in a shooting star candlestick on February 24th at 1.4376. The pair then pulled back into the channel. As we often see, a false breakout on one side of the channel often leads to a test of the opposite trendline. GBP/USD formed a descending wedge off the highs and moved below the bottom, upward sloping channel of the trendline. The pair held the 38.2% Fibonacci retracement level from the September 23rd, 2020 lows to the February 24th highs, near 1.3630. Last week, GBP/USD broke above the descending wedge and has since moved higher back into the channel. The target for the breakout of a descending wedge is a 100% retracement, which is the recent highs at 1.4237.
Source: Tradingview, FOREX.com
On a 240-minute timeframe, as of the time of this writing, GBP/USD is at resistance at the 50% retracement level from the February 23rd highs to the April 12th lows near 1.3956. The psychological round number 1.4000 level acts as the level of resistance above, and then the 61.8% Fibonacci retracement level from the same time period at 1.4025. First support is at Monday’s lows near 1.3810. The next level of support is the top, downward channel of the wedge near 1.3680, and then the recent lows near 1.3665. Notice that the RSI has moved into overbought territory above 70, which indicates that the pair may be ready for a near-term pullback.
Source: Tradingview, FOREX.com
With the reopening of the UK underway and the reopening of the US in full swing, the British Pound may outperform the US Dollar. In addition, the pullback on the daily chart to the 38.2% longer-term Fibonacci retracement level indicates a weak pullback and that the bulls are in control. A break below the 50% level near 1.3450 would indicate the pair is in trouble.
Learn more about forex trading opportunities.
Related tags:
Latest market news




The complete CFD trading experience
Award-winning platforms, competitive spreads, low commissions and dedicated support.
We live and breathe the markets and are dedicated to helping traders realise their ambitions as we continue to set the industry bar.
Economic calendar
Web Trader platform
Our sophisticated web-based platform is packed with features.
Related articles
EUR/USD Forecast: Euro Struggles to Find Support Even After U.S. PCE Data
The euro continues to face a challenging environment in the short term. The currency has struggled to regain ground against a U.S. dollar that remains firmly supported, a dynamic reflected in EUR/USD, which has now recorded three consecutive losing sessions and a decline of roughly 0.6%.
Canadian Dollar Forecast: USD/CAD Four-Week Rally Eyes Yearly Highs 9 30 2026
USD/CAD has advanced in 14 of the past 15 sessions, but stretched momentum raises the stakes as major resistance and NFP come into focus.


British Pound Technical Outlook: GBP/USD Rebound Challenges September Downtrend 9 30 2026
Sterling has rallied sharply from key support, with GBP/USD at an inflection point that could determine whether a larger recovery is underway.
StoneX Europe Ltd may make third party material available on this website which may contain information included but not limited to the conditions of financial markets. The material is for information purposes only and does not contain, and should not be construed as containing, investment advice and/or investment recommendation and/or an investment research and/or an offer of or solicitation for any transactions in financial instruments; any decision to enter into a specific transaction shall be made by the client following an assessment by him/her of their situation.
StoneX Europe Ltd makes no representation or warranty and assumes no liability as to the accuracy or completeness of the information provided, nor any loss arising from any investment based on a recommendation, forecast or other information supplied. You should always seek independent advice as to your suitability to speculate in any related markets and your ability to assume the associated risks, if you are at all unsure. We are not under any obligation to update any such material. Any opinion made may be personal to the author and may not reflect the opinion of StoneX Europe Ltd.